
Description
FW Manual Volume Profile
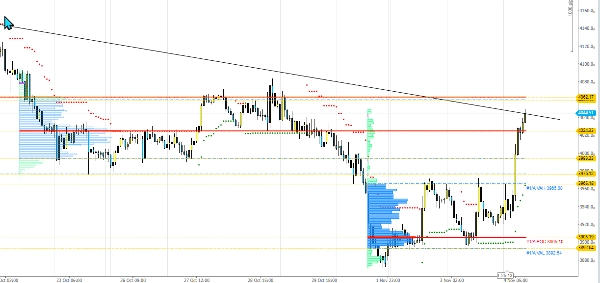
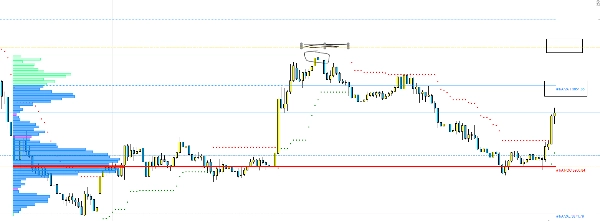
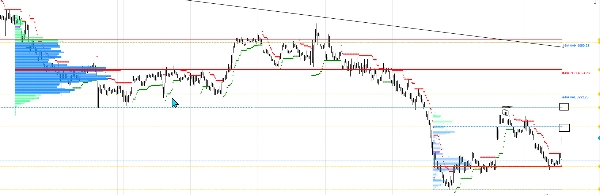
Choose a time range and see where estimated tick volume is concentrated. This chart-overlay indicator for cTrader desktop displays a horizontal volume profile with Point of Control (POC), Value Area High (VAH) and Value Area Low (VAL).
WHAT THE LEVELS MEAN
POC is the price row with the highest estimated volume. VAH and VAL mark the boundaries of the selected Value Area, which defaults to 70%. These are analysis levels, not automatic buy or sell instructions.
MAIN FEATURES
• Draw multiple ranges manually, or use the shortcut for the last 100 completed chart bars.
• Choose fixed ranges or live ranges that extend with new data.
• Use four configurable templates with independent Value Area, row resolution, width and alignment.
• Adjust colours, transparency, labels, line styles and row spacing.
• Display optional local low-volume-node markers and TPO-based Single Print estimates.
• Save and restore profiles locally using cTrader storage.
DATA AND CALCULATION
The indicator uses broker-provided M1 candles and tick volume. Each minute's volume is distributed across that candle's high-low range as an estimate. It does not show actual exchange volume, order-book liquidity or aggressor-side bid/ask delta. Directional colours follow M1 candle direction. TPO annotations are estimates, not tick-by-tick time-at-price measurements.
History quality and availability affect the result. Gaps can reflect missing data or market closures. Live values can change while the current minute is forming. More rows and longer ranges increase processing requirements.
ALERTS AND MOBILE USE
Optional POC, VAH and VAL alerts use either desktop popup/sound or native cTrader price alerts. Messages are concise, for example “FW VP · POC · 123.45”. Touch/crossing behaviour, tolerance, cooldown and rearming distance/time are configurable.
The indicator and its custom chart drawings run on desktop; they are not displayed by cTrader Mobile or Web. Native alert appearance and mobile notifications are controlled by cTrader and the user's account/device settings. Desktop line colours are not transferred as custom mobile alert colours. Desktop popup alerts and automatic level updates require the indicator to remain running. Native alerts created by this instance are removed when the indicator is stopped or removed.
SETUP AND SUITABLE USE
Use cTrader desktop with Algo API 5.5 or newer and a time-based chart with sufficient M1 history. Designed for discretionary traders who understand POC, Value Area and the limitations of tick-volume estimates. Compare selected sessions or swings, inspect volume concentration and monitor chosen price levels. No specific account size or leverage is required: this indicator does not place orders.
Parameters and the chart toolbar use German labels. The main modes are “Fest” (fixed), “Live”, “PopupUndTon” (popup/sound) and “NativeKursalarme” (native price alerts). Profile storage is local; it does not synchronise profiles between devices. Use distinct storage identifiers for chart instances that should keep separate profiles.
Version 0.8.5.4. The gallery uses chart examples from 3–4 November 2026 to illustrate the unchanged profile calculation. Red/green Supertrend dots, trend lines and hand-drawn annotations belong to separate tools and are not included. Interface details may differ between versions.
Trading involves risk. This is an analysis tool, not investment advice or a guarantee of trading results.
Summary
The indicator supports four customizable templates with independent settings for Value Area, row resolution, width, and alignment. Visual elements such as colors, transparency, labels, line styles, and row spacing are adjustable. Additional features include optional markers for low-volume nodes and TPO-based Single Print estimates. Profiles can be saved and restored locally within cTrader.
Volume data is derived from broker-provided 1-minute candles and tick volume, distributing volume across each candle’s high-low range as an estimate. The tool does not use actual exchange volume or order book data. Alerts for POC, VAH, and VAL levels can be configured with desktop popups, sounds, or native cTrader price alerts, including customizable touch behavior and cooldown settings.
Designed for discretionary traders familiar with volume profile concepts, this indicator aids in analyzing volume concentration and key price levels but does not execute trades. It operates exclusively on cTrader desktop and requires sufficient M1 historical data.