
Description
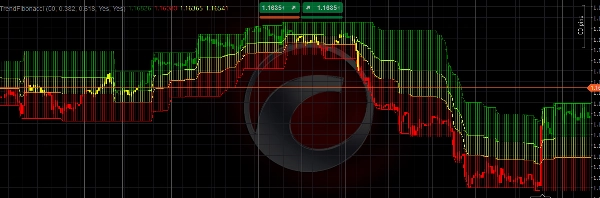
L'indicateur TrendFibonacci est conçu pour aider les traders à identifier avec précision les niveaux de prix critiques et les tendances du marché. En intégrant les niveaux de retracement de Fibonacci avec une moyenne mobile pondérée (WMA) et la plage vraie moyenne (ATR), cet indicateur offre une représentation visuelle claire du support, de la résistance et de la direction de la tendance.
Caractéristiques principales :
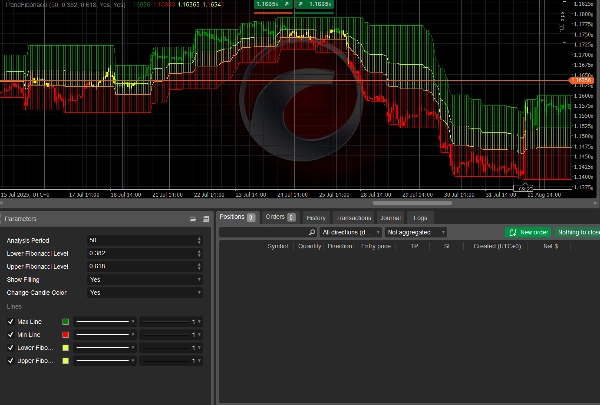
- Niveaux de Fibonacci dynamiques : Calcule et trace automatiquement les niveaux de retracement de Fibonacci (par défaut : 0,382 et 0,618) basés sur le plus haut et le plus bas sur une période de retour définie par l'utilisateur.
- Moyenne mobile pondérée (WMA) : Utilise une WMA de 6 périodes pour évaluer la direction de la tendance, avec des chandeliers codés par couleur (vert pour haussier, rouge pour baissier, jaune pour neutre) reflétant la position de la WMA par rapport aux niveaux de Fibonacci.
- Paramètres personnalisables : Ajustez la période d'analyse, les niveaux de Fibonacci, et activez ou désactivez des fonctionnalités comme les zones remplies et les changements de couleur des chandeliers.
- Clarté visuelle : Trace les lignes haut/bas et remplit les zones entre les niveaux de Fibonacci avec des couleurs semi-transparentes pour une identification facile des tendances.
- Intégration de l'ATR : Intègre un ATR de 200 périodes pour une analyse robuste du marché, garantissant une adaptabilité à la volatilité.
Cet indicateur est idéal pour les traders cherchant à combiner l'analyse de Fibonacci avec des stratégies de suivi de tendance. Que vous négociiez sur le forex, les actions ou les matières premières, TrendFibonacci améliore votre capacité à repérer les zones clés de retournement et à prendre des décisions de trading éclairées.
Comment utiliser
- Installer l'indicateur :
-
- Ajoutez l'indicateur TrendFibonacci à votre plateforme cTrader en téléchargeant le code source ou en le récupérant depuis la marketplace.
- Configurer les paramètres :
-
- Période d'analyse : Définissez la période de retour (par défaut : 50 barres) pour déterminer la plage de calcul des prix haut/bas.
- Niveau inférieur de Fibonacci : Ajustez le niveau inférieur de retracement de Fibonacci (par défaut : 0,382).
- Niveau supérieur de Fibonacci : Ajustez le niveau supérieur de retracement de Fibonacci (par défaut : 0,618).
- Afficher le remplissage : Activez/désactivez les zones remplies entre les niveaux de Fibonacci (par défaut : activé).
- Changer la couleur des chandeliers : Activez/désactivez les chandeliers codés par couleur selon la position de la WMA (par défaut : activé).
- Interpréter l'indicateur :
-
- Chandeliers verts : Indiquent une tendance haussière lorsque la WMA est au-dessus du niveau supérieur de Fibonacci.
- Chandeliers rouges : Signalent une tendance baissière lorsque la WMA est en dessous du niveau inférieur de Fibonacci.
- Chandeliers jaunes : Suggèrent une zone neutre lorsque la WMA se situe entre les niveaux de Fibonacci.
- Zones remplies : Visualisent les zones clés de prix entre les lignes haut/bas et les niveaux de Fibonacci pour l'analyse du support/résistance.
- Application en trading :
-
- Utilisez l'indicateur pour identifier les points d'entrée/sortie potentiels aux niveaux de Fibonacci.
- Combinez avec d'autres outils techniques (par exemple, RSI, MACD) pour confirmation.
- Surveillez les chandeliers codés par couleur pour évaluer la force et la direction de la tendance.
- Bonnes pratiques :
-
- Testez l'indicateur sur un compte démo pour vous familiariser avec son comportement.
- Ajustez les paramètres pour convenir à votre style de trading et aux conditions du marché.
- Utilisez-le sur des unités de temps plus élevées (par exemple, H1, H4) pour des signaux plus fiables.
L'indicateur TrendFibonacci est un outil polyvalent pour les traders de tous niveaux, offrant des informations claires et exploitables sur les tendances du marché et les niveaux de prix.
Résumé
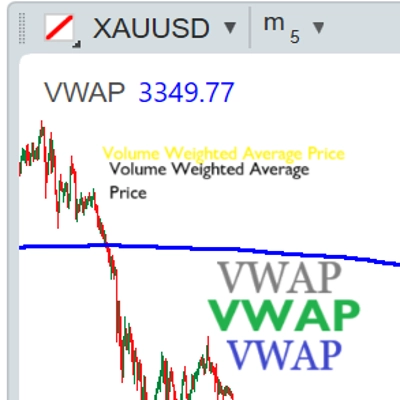
Users can customize parameters such as the analysis period, Fibonacci levels, and visual features like filled zones between Fibonacci levels and candle color changes. The indicator visually highlights support and resistance zones by plotting high/low lines and filling areas between Fibonacci levels with semi-transparent colors. It is applicable across various markets including forex, stocks, commodities, and popular symbols like BTCUSD, EURUSD, GBPUSD, and XAUUSD.
TrendFibonacci supports traders in spotting potential entry and exit points at Fibonacci levels and can be combined with other technical tools like RSI and MACD for confirmation. It is recommended for use on higher timeframes (e.g., H1, H4) to enhance signal reliability.


![Logo de "[CB] Pivot Points Pro"](https://cdn.ctrader.com/image/webp/43463c82-67b0-4f10-a4ba-901bba091d81_32594)


![Logo de "[Hamster-Coder] Pivot Points MTF"](https://cdn.ctrader.com/image/webp/4c143e5a-309c-40e3-a578-f04d1e133ffa_31159)
