
Mô tả
Chỉ báo PHÂN TÍCH KỸ THUẬT là một giải pháp phân tích kỹ thuật tiên tiến được phát triển cho nền tảng cAlgo, tích hợp nhiều chỉ báo kỹ thuật tập trung vào việc xác định các xu hướng mạnh mẽ, động lượng thị trường và xác nhận khối lượng. Nó kết hợp ADX (Chỉ số Hướng Trung bình) với phân tích độ dốc, lọc khối lượng và phân tích kỹ thuật đa chỉ báo theo thời gian thực, cung cấp cho nhà giao dịch một cái nhìn toàn diện và đáng tin cậy để ra quyết định.
🔍 Chiến lược chính
1. Cơ sở: ADX + DI (Hệ thống Di chuyển Hướng)
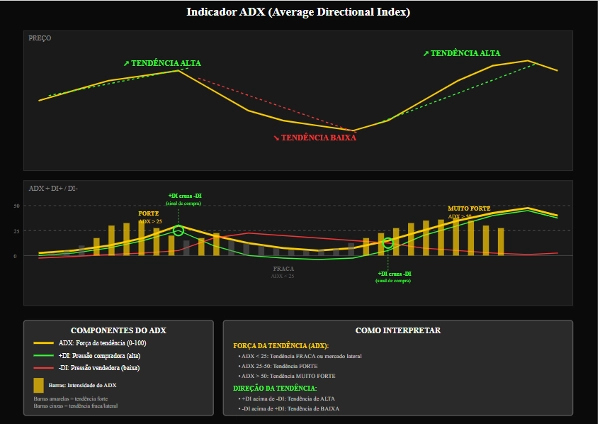
Cốt lõi của chỉ báo là ADX (Chỉ số Hướng Trung bình), đo lường sức mạnh của xu hướng.
Các thành phần +DI (Chỉ báo Hướng Tích cực) và -DI (Chỉ báo Hướng Tiêu cực) xác định hướng của xu hướng:
+DI > -DI → Xu hướng tăng
-DI > +DI → Xu hướng giảm
2. Phân tích Động lượng Động với Độ dốc
Độ dốc của ADX, +DI và -DI được tính bằng hồi quy tuyến tính.
Điều này cho phép xác định liệu xu hướng có đang:
Tăng cường sức mạnh (độ dốc dương)
Giảm sức mạnh (độ dốc âm)
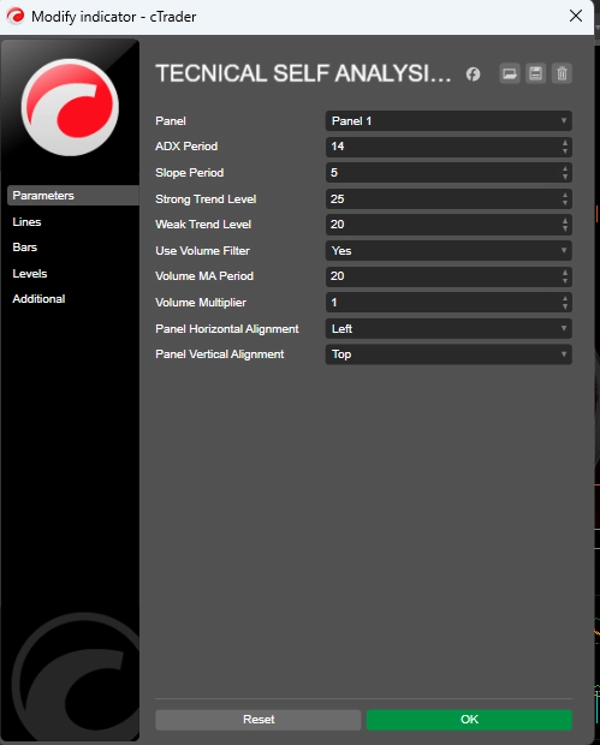
3. Mức Tham chiếu
Mức Xu hướng Mạnh: Mức trên đó xu hướng được coi là mạnh (mặc định: 25)
Mức Xu hướng Yếu: Mức tối thiểu để xem xét một xu hướng hợp lệ (mặc định: 20)
Các xu hướng dưới mức yếu được coi là đi ngang hoặc không có hướng rõ ràng.
📈 Tạo Tín hiệu
Điều kiện Mua
✅ +DI cắt lên trên -DI
✅ ADX trên mức xu hướng yếu (Mức Xu hướng Yếu)
✅ Độ dốc ADX và +DI dương
✅ Xác nhận khối lượng (tùy chọn)
Điều kiện Bán
✅ -DI cắt lên trên +DI
✅ ADX trên mức xu hướng yếu (Mức Xu hướng Yếu)
✅ Độ dốc ADX và -DI dương
✅ Xác nhận khối lượng (tùy chọn)
Tín hiệu Mạnh: Khi ADX trên Mức Xu hướng Mạnh và các độ dốc dương đáng kể, chỉ báo tạo ra các tín hiệu củng cố, tránh các lần vào lệnh lặp lại liên tiếp. 📊 Bộ Lọc Khối Lượng (Tùy chọn)
Chỉ báo có thể yêu cầu xác nhận khối lượng trước khi tạo tín hiệu.
Khối lượng hiện tại phải lớn hơn hoặc bằng trung bình động của khối lượng × hệ số nhân.
Điều này giúp lọc các phá vỡ giả và tín hiệu trong các thị trường thanh khoản thấp.
🧠 Phân tích Kỹ thuật Nâng cao (Bảng điều khiển Tương tác)
PHÂN TÍCH KỸ THUẬT bao gồm hai bảng điều khiển tương tác trên biểu đồ:
1. THÔNG TIN XU HƯỚNG
Loại Xu hướng: Xu hướng tăng / Xu hướng giảm / Đi ngang
Sức mạnh Xu hướng: Mạnh / Yếu
Động lượng: Tăng cường / Yếu đi / Ổn định
Giá trị hiện tại của ADX, +DI, -DI và Độ dốc
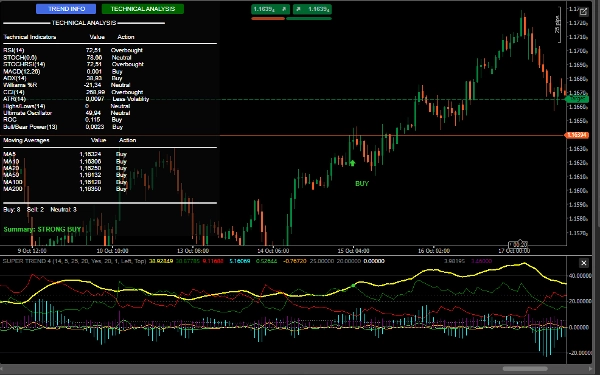
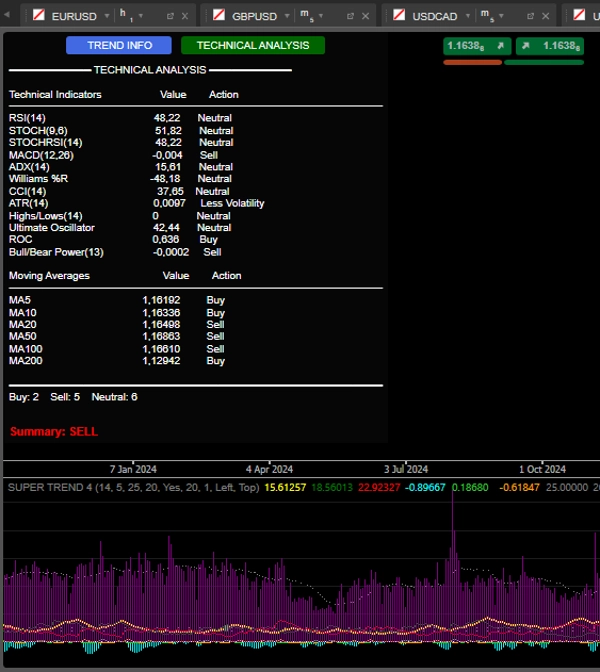
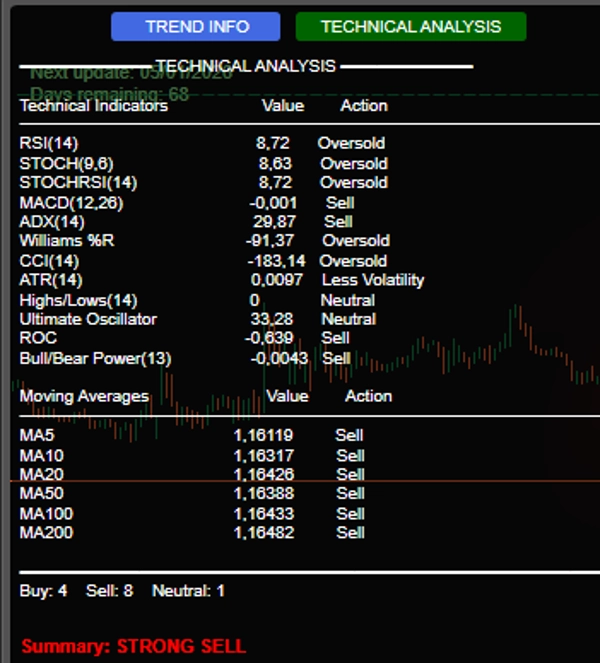
2. PHÂN TÍCH KỸ THUẬT
Thực hiện phân tích đa chỉ báo theo thời gian thực, bao gồm:
RSI(14) – Quá mua/Quá bán
Stochastic(14) – Động lượng
MACD(12,26) – Giao cắt và phân kỳ
Williams %R – Cực trị thị trường
CCI(14) – Sai lệch so với giá điển hình
ROC(12) – Tốc độ thay đổi
Ultimate Oscillator – Xác nhận sức mạnh
Bull/Bear Power – Áp lực mua/bán
Đường Trung bình Động (5,10,20,50,100,200) – Xu hướng dài hạn
Tóm tắt cuối cùng: Hệ thống đếm các tín hiệu mua/bán/trung lập và đưa ra khuyến nghị rõ ràng:
MUA MẠNH (≥7 tín hiệu mua)
MUA
BÁN
BÁN MẠNH (≥7 tín hiệu bán)
TRUNG LẬP
🔔 Cảnh báo và Hiển thị
Tín hiệu trực quan trên biểu đồ:
Mũi tên xanh/lửa với nhãn "MUA"/"BÁN"
Thông báo âm thanh (Windows)
Nhật ký chi tiết trong bảng điều khiển với:
Thời gian tín hiệu
Giá trị ADX, DI và khối lượng (nếu được bật)
🛡️ Vantagens Competitivas
✅ Integração de múltiplos indicadores em um único painel
✅ Foco na força e direção da tendência (não apenas preço)
✅ Filtro de volume para maior confiabilidade
✅ Interface interativa e informativa
✅ Sinais claros com alertas visuais e sonoros
Đây là phiên bản thử nghiệm.


