
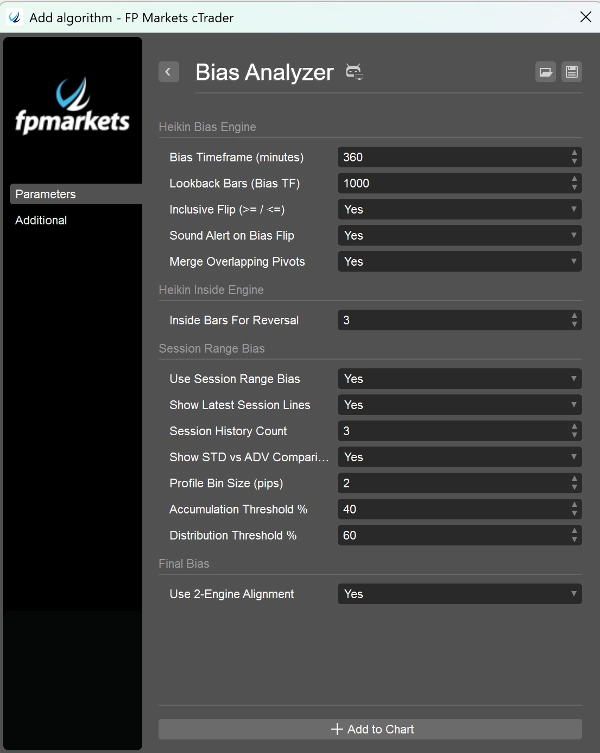
Bias Analyzer
cBot
版本 3.0, Dec 2025
Windows 版、Mac 版, Mobile, Web
说明
偏见分析器——一个干净的、基于规则的“市场环境”仪表盘
大多数交易错误并不是错误的入场点——它们是 错误环境下的良好入场点。
偏见分析器旨在解决这个问题:它使用两个独立引擎为您提供一致的方向性读取,并将结果直接显示在您的图表上。
重要: 偏见分析器是一个分析性、可视化工具。它 不会开仓、修改或平仓交易。
偏见分析器显示的内容
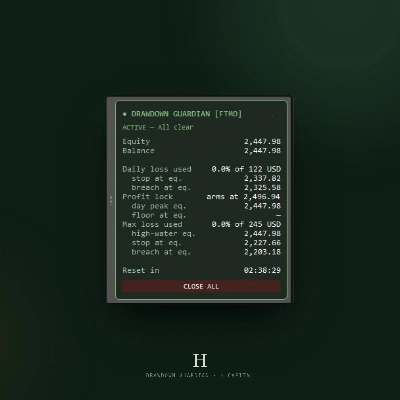
✅ 一个紧凑的 左上角仪表盘,包含:
- Heikin偏见(看涨 / 看跌 / 待定)
- 会话偏见(看涨 / 看跌 / 中性 / 待定)
- 最终对齐偏见(看涨 / 看跌 / 中性 / 待定)
- 会话引擎的置信度百分比
- 每会话统计:ADV% 对比 STD%,Δ 点数,激增计数,主导性
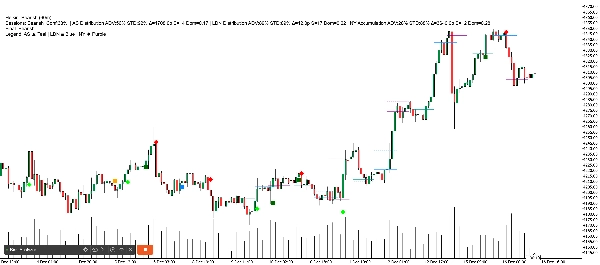
✅ 会话POC线(最新会话或多会话历史)
- ADV POC= 较粗的实线(主要)
- STD/基础POC= 虚线(可选比较)
引擎1——Heikin Ashi枢轴偏见(结构)
该引擎读取您选择的 偏见时间框架上的Heikin Ashi“颜色翻转”,并构建枢轴区:
- 可选的 重叠枢轴合并
- 当价格突破最新的相反区间(包含或严格)时,偏见翻转
- 包含一个 内棒盘绕模块(仅实体)用于早期延续/反转环境
将其用作您的高时间框架“压力”过滤器。
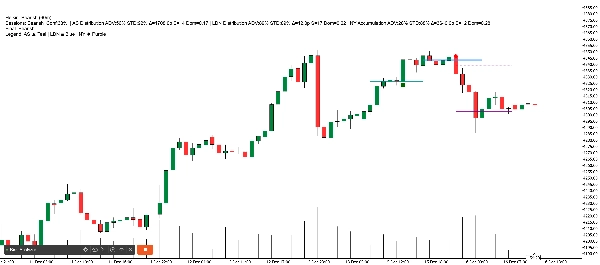
引擎2——会话区间偏见(亚洲 / 伦敦 / 纽约)
偏见分析器评估 最近完成的亚洲、伦敦和纽约会话,并应用严格的 三选二投票:
- 每个会话计算 最低/最高和POC
- 根据POC在会话区间中的位置对会话进行分类:
-
- 接近底部 → 积累(看涨票)
- 接近顶部 → 分配(看跌票)
- 中间 → 平衡(无票)
ADV POC(决定性因素)
ADV不将蜡烛实体视为“真相”,而是关注价格被成交量拒绝的位置:
- 检测M15 激增蜡烛(成交量≥前一蜡烛)
- 使用 仅烛芯区间并按烛芯长度分配成交量
- 通过以下方式增加意图权重:
-
- 激增蜡烛的烛芯不平衡
- 下一根蜡烛颜色
- 同一会话中稍后首次突破激增高/低点
- 构建会话轮廓并选择得分最高的 ADV POC
STD/基础POC 仍可用于比较(以便您看到ADV所改变的内容)。
最终偏见(对齐)
启用双引擎对齐时:
- 如果 Heikin和会话一致 → 最终 = 看涨/看跌
- 如果它们 冲突 → 最终 = 中性
- 如果数据不足 → 最终 = 待定
此设计旨在避免您进入“混合信号”状态。
最佳适用
- 任何具有稳定成交量的品种(推荐外汇主流/次级货币对、指数、贵金属)
- 任何图表时间框架(内部使用 M5 用于会话区间,M15 用于ADV激增)
风险声明
交易存在风险。偏见分析器仅提供分析信息,不保证结果。请始终在模拟账户中测试并使用您自己的风险管理。
摘要
交易概览
客户评价
0.0
评价:0
客户评价
该产品尚无评价。已经试过了?抢先告诉其他人!
讨论
常见问答
BTCUSD
Forex
Signal
Breakout
Indices
EURUSD
Commodities
GBPUSD
NZDUSD
Martingale
Prop
Scalping
Supertrend
SMC
Crypto
Grid
Stocks
AI
XAUUSD
NAS100
USDJPY
VWAP
cTrader Store 提供的所有产品,包括交易机器人、指标和插件,均由第三方开发者提供,仅供信息参考和技术访问之用。cTrader Store 并非经纪商,不提供投资建议、个人推荐或任何未来业绩保证。
该作者的其他作品


猜您喜欢


价格
注册日期 25/03/2025
176.09M
交易量
2.15M
盈利点数
21
销售