Описание
Тепловая карта ликвидности - профессиональный анализ опорных точек на нескольких таймфреймах
Преобразуйте свою торговлю с помощью продвинутой визуализации ликвидности. Этот мощный индикатор выявляет зоны институциональной ликвидности, анализируя опорные точки на 10 различных таймфреймах одновременно, создавая динамическую тепловую карту, которая точно показывает, где, вероятно, находится умные деньги.
Как это работает
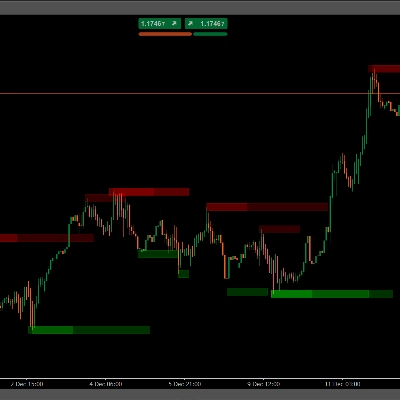
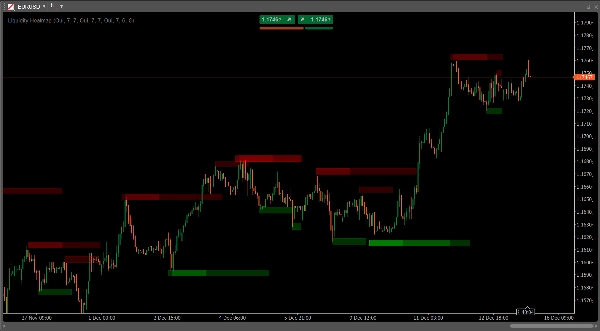
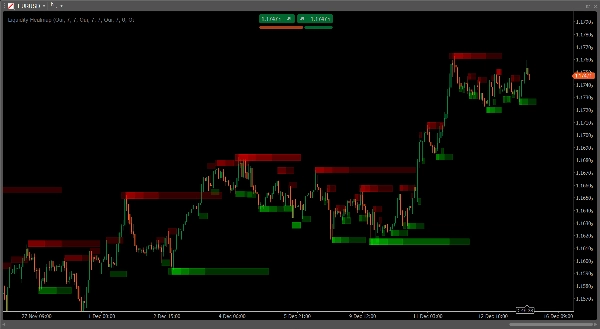
Индикатор обнаруживает максимумы и минимумы опорных точек на нескольких таймфреймах (15мин, 30мин, 1ч, 2ч, 4ч, дневной, 8ч, 3д, недельный, месячный) и накладывает полупрозрачные зоны на каждом уровне опорной точки. Там, где сходятся несколько опорных точек с разных таймфреймов, зоны накладываются друг на друга и усиливаются по цвету, создавая «тепловой отпечаток», который показывает самые сильные уровни ликвидности на вашем графике.
Ключевые особенности
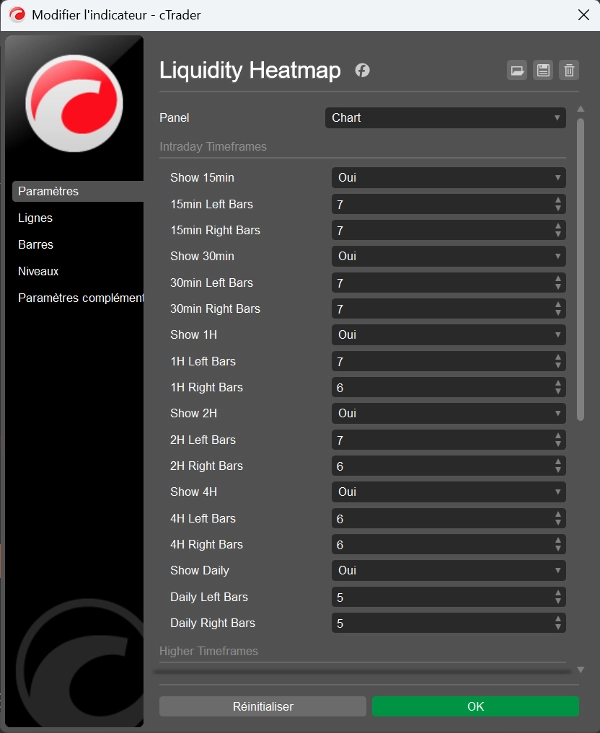
- 10 настраиваемых таймфреймов: Анализируйте одновременно от внутридневного (15мин) до долгосрочного (месячного) перспективы
- Интеллектуальное отображение плотности: Накладывающиеся зоны автоматически создают более темные области, показывающие конвергенцию ликвидности
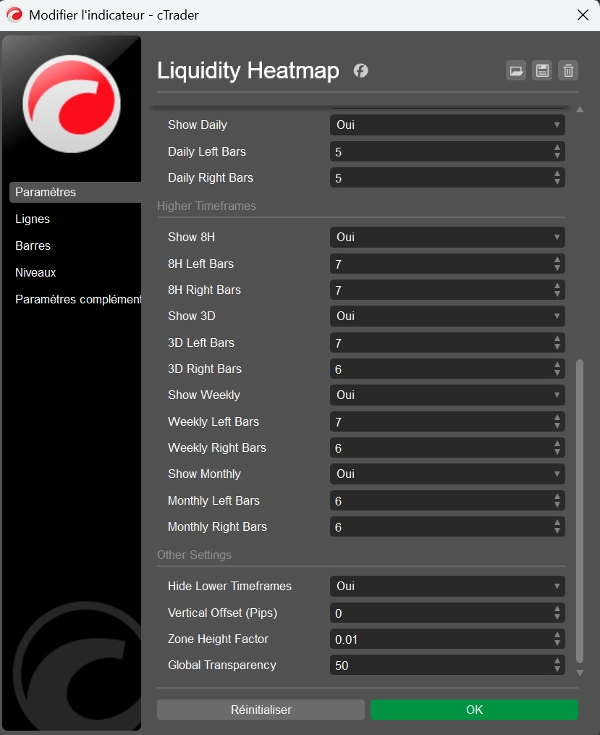
- Полностью регулируемое обнаружение опорных точек: Настраивайте количество баров слева/справа (2-20) для каждого таймфрейма независимо
- Адаптивная визуализация: Высота зоны автоматически масштабируется с увеличением графика для постоянного внешнего вида
- Временные закрепленные зоны: Зоны остаются закрепленными на точном времени их формирования, не смещаясь на вашем графике
- Настраиваемая прозрачность: Управляйте глобальной прозрачностью (0-255) в соответствии с вашим стилем графика
- Умная фильтрация таймфреймов: Возможность скрывать более низкие таймфреймы в зависимости от текущего вида графика
- Контроль вертикального смещения: Точная настройка позиционирования зоны с помощью регулировки в пипсах
- Отдельное цветовое кодирование: Красные зоны для максимумов опорных точек (сопротивление), зеленые для минимумов (поддержка)
Идеально подходит для
- Трейдеров, использующих концепции Smart Money (SMC) для определения пулов ликвидности
- Последователей методологии ICT, отслеживающих институциональные уровни
- Свинг-трейдеров, ищущих зоны с высокой вероятностью разворота
- Скальперов, определяющих внутридневные захваты ликвидности
- Любых трейдеров, ищущих конвергенцию на нескольких таймфреймах
Применение в торговле
Тепловая карта показывает, где сосредоточены стоп-лоссы и где, вероятно, находятся институциональные ордера. Используйте эти зоны для:
- Предвидения ликвидных выметаний и разворотов
- Определения сильных конвергенций поддержки/сопротивления
- Поиска оптимальных точек входа после захватов ликвидности
- Установки стратегических стоп-лоссов за ключевыми зонами ликвидности
- Подтверждения достоверности пробоя, наблюдая за потреблением ликвидности
Почему этот индикатор выделяется
В отличие от базовых индикаторов опорных точек, показывающих уровни одного таймфрейма, эта тепловая карта агрегирует данные с 10 таймфреймов одновременно, предоставляя вам всесторонний обзор структуры рынка. Визуализация плотности мгновенно показывает, какие уровни имеют наибольшее значение — чем темнее зона, тем больше таймфреймов согласны с этим уровнем ликвидности.
Оптимизированная производительность
Эффективно обрабатывает до 500 баров на таймфрейм с умным управлением объектами, обеспечивая плавную работу графика даже при включении всех таймфреймов.
Простая настройка
Установите и начните торговать сразу с оптимизированными настройками по умолчанию или настройте каждый параметр под вашу конкретную стратегию и стиль торговли.
Повышайте качество анализа ликвидности и торгуйте с пониманием институционального потока ордеров. Идеально подходит для трейдеров, которые понимают, что цена не движется случайно — она движется к ликвидности.
Сводка
Key features include customizable pivot detection parameters for each timeframe, adaptive zone visualization that scales with chart zoom, and separate color coding for resistance (red) and support (green) zones. The indicator also offers adjustable transparency, vertical offset control, and smart timeframe filtering to hide lower timeframes based on the current chart view.
This tool is suitable for traders using Smart Money Concepts, ICT methodology, swing trading, scalping, or any strategy requiring multi-timeframe liquidity analysis. It helps identify clusters of stop losses and institutional orders to anticipate liquidity sweeps, reversals, strong support/resistance levels, optimal entry points, strategic stop losses, and breakout confirmations.
Liquidity Heatmap efficiently processes up to 500 bars per timeframe with optimized object management, ensuring smooth performance. It supports various markets including Forex, Crypto, Stocks, Indices, and Commodities. The indicator comes with optimized default settings and full customization options to fit different trading styles.
Отзывы покупателей
5 | 100 % | |
4 | 0 % | |
3 | 0 % | |
2 | 0 % | |
1 | 0 % |


