
Description
📊 Aperçu
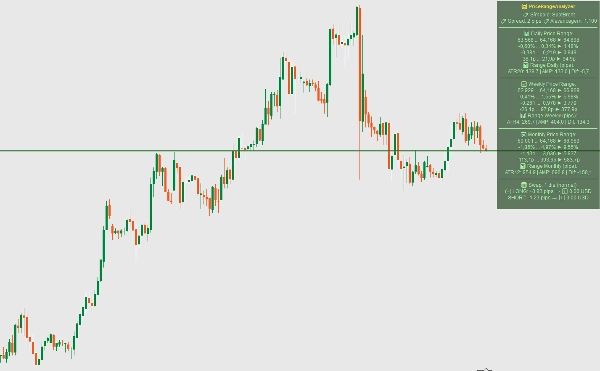
Panneau d'information complet et multi-échelles qui consolide les données essentielles du marché, l'analyse de la plage basée sur l'ATR et les calculs intelligents de swap en une interface unique et personnalisable. Conçu pour les traders sérieux qui ont besoin d'un accès rapide aux métriques de trading critiques sur plusieurs échelles temporelles.
✨ Fonctionnalités clés
Analyse Multi-Échelles
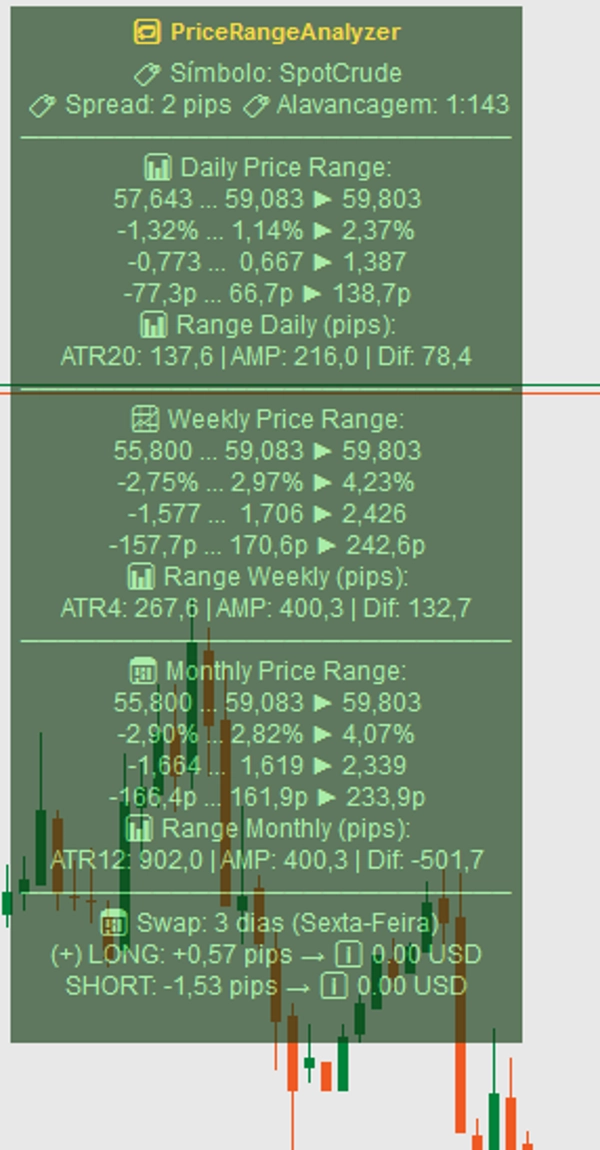
- Plages de prix quotidiennes, hebdomadaires et mensuelles et variations
- Calculs ATR simultanés pour toutes les échelles temporelles avec périodes personnalisables
- Calculs en temps réel de pourcentage et de variation en pips
- Visualisation des plages de prix avec indicateurs directionnels
Gestion Intelligente des Swaps
- Détection automatique du triple swap (mercredi & vendredi)
- Listes de symboles personnalisables pour différents calendriers de swap
- Calcul en temps réel du swap pour les positions ouvertes
- Support des symboles basés sur % et sur pips
Affichage Professionnel
- Position du panneau entièrement personnalisable (4 coins)
- Schéma de couleurs dynamique basé sur la direction du marché
- Taille de police ajustable et opacité
- Disposition claire et organisée des informations
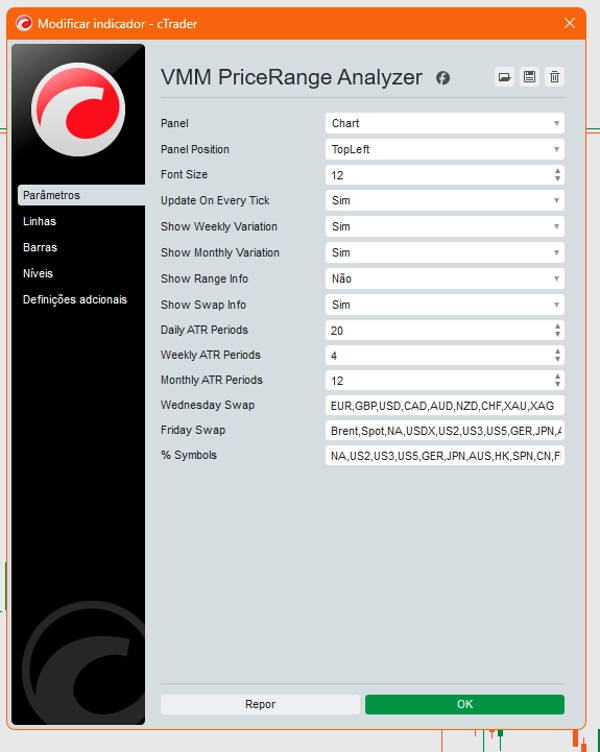
⚙️ Paramètres
Configuration du Panneau
Position du Panneau- Choisissez parmi 4 coins de l'écran (TopLeft, TopRight, BottomLeft, BottomRight)Taille de la Police- Ajustez la taille du texte pour la lisibilitéMise à jour à chaque tick- Mises à jour en temps réel ou uniquement à la clôture des barresAfficher la Variation Hebdomadaire- Activer/désactiver l'affichage des données hebdomadairesAfficher la Variation Mensuelle- Activer/désactiver l'affichage des données mensuellesAfficher les Infos de Plage- Afficher les informations détaillées sur la plageAfficher les Infos de Swap- Afficher les calculs de swap
Paramètres ATR
Périodes ATR Quotidiennes- Périodes pour le calcul ATR quotidien (1-100)Périodes ATR Hebdomadaires- Périodes pour le calcul ATR hebdomadaire (1-100)Périodes ATR Mensuelles- Périodes pour le calcul ATR mensuel (1-100)
Configuration des Symboles
Swap du Mercredi- Symboles séparés par des virgules avec triple swap du mercrediSwap du Vendredi- Symboles séparés par des virgules avec triple swap du vendrediSymboles %- Symboles où les valeurs sont basées sur un pourcentage vs basées sur les pips
🔧 Comment ça fonctionne
Analyse de Plage
Calcule et affiche :
- Prix actuel par rapport aux plages quotidiennes/hebdomadaires/mensuelles
- Variations en pourcentage par rapport aux clôtures précédentes
- Mouvements en pips pour une planification précise des entrées/sorties
- Mesures de volatilité basées sur l'ATR
Intelligence des Swaps
- Détecte automatiquement quand le triple swap s'applique
- Calcule les coûts de swap pour les positions longues et courtes
- Affiche les coûts réels de swap pour les positions actuellement ouvertes
- Supporte différents types de symboles avec calculs appropriés
Indicateurs Visuels
- Les couleurs du panneau changent selon la direction quotidienne du marché
- Panneau vert pour les jours haussiers, rouge pour les jours baissiers
- Flèches directionnelles claires montrant le mouvement des prix
- Sections organisées avec séparateurs pour une lecture facile
🎯 Cas d'Utilisation
Pour les Traders de Position
- Surveillez les plages multi-échelles pour un meilleur timing d'entrée
- Comprenez les coûts de swap avant de conserver une position overnight
- Suivez les évolutions des prix hebdomadaires et mensuelles
Pour les Traders Journaliers
- Accès rapide aux informations sur le spread et l'effet de levier
- Surveillez la plage quotidienne et l'ATR pour évaluer la volatilité
- Planifiez les trades en fonction des niveaux hauts/bas quotidiens
Pour Tous les Traders
- Vue consolidée des métriques de trading critiques
- Prévention des erreurs coûteuses de calcul de swap
- Interface professionnelle et épurée qui économise de l'espace écran
📈 Avantages
- Gain de Temps - Toutes les informations essentielles en un seul endroit
- Prévention des Erreurs - Calculs automatiques des swaps
- Meilleures Décisions - Perspective multi-échelles
- Personnalisable - S'adapte à votre style de trading
- Professionnel - Affichage propre de qualité institutionnelle
⚡ Performance
- Optimisé pour une utilisation minimale du CPU
- Mises à jour uniquement lorsque nécessaire (configurable)
- Gestion efficace de la mémoire pour les sessions longues
Parfait pour les traders qui veulent une intelligence de marché de qualité professionnelle sans avoir à basculer entre plusieurs fenêtres ou calculateurs !
Résumé
Avis clients
5 | 100 % | |
4 | 0 % | |
3 | 0 % | |
2 | 0 % | |
1 | 0 % |


