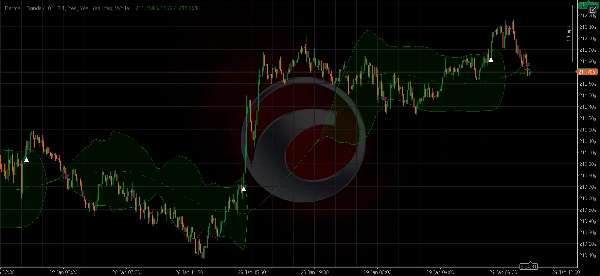
Logo de "Bermaui."
Indicateur
Version 1.0, Jan 2026
Windows, Mac
Image mise en ligne de "Bermaui."
Depuis le 28/01/2026
À propos de la version d'essai
No Alerts And Arr.

Bermaui Bands (BB) is a technical analysis tool that helps filter between ranging and trending price movements. The idea behind this indicator can be explained in the next steps -

  1. Calculate Standard Deviation as an oscillator that moves between 0 and 100. Will name it Bermaui Deviation percent (BD percent).
  2. If "BD percent" is near zero then volatility is at its extreme. In addition, if "BD percent" is near 100 then volatility is very low.
  3. High volatility means a great probability for a trending market, while low volatility means side-way or ranging market.
  4. Middle Line is a Simple Moving Average because Standard Deviation is calculated depending on Moving Average.
  5. Add "BD percent" to a simple moving average with the same number of bars in the calculation to get The Upper Bermaui Band.
  6. Subtract "BD percent" from a simple moving average with the same number of bars in the calculation to get The Lower Bermaui Bands.
À propos de la version d'essai
No Alerts And Arr.
Profil de l'indicateur
0.0
Avis : 0
Avis clients
Il n'y a pas encore d'avis sur ce produit. Vous l'avez déjà essayé ? Soyez le premier à en parler aux autres !
Forex
Signal
Breakout
Indices
Commodities
Crypto
Stocks
Les produits disponibles sur cTrader Store, notamment les bots de trading, les indicateurs et les plug-ins, sont fournis par des développeurs tiers et mis à disposition à titre informatif et à des fins d'accès technique uniquement. cTrader Store n'est pas un courtier et ne fournit aucun conseil en investissement, aucune recommandation personnelle ni aucune garantie quant aux performances futures.

Vous pourriez aussi aimer

Indicateur
Breakout
Fibonacci
Track Initial Balance ranges across any period with optional Fibonacci levels and projections.
Indicateur
Grid
Prop
+16
This technical analysis indicator provides information on market sentiment, trend and price levels....
Indicateur
Forex
Crypto
+3
Day of Week Indicator for cTrader
Indicateur
Show your Daily/Weekly Risk
Indicateur
Forex
Crypto
+3
Trend filter based on Alfred François Tagher's price-time methodology. Identifies trends when close breaks prior period'
Indicateur
Forex
FREE Candlestick Pattern Recognizer
Indicateur
Forex
BTCUSD
+10
Multi-timeframe pivot points with 8 support/resistance levels. Professional trading tool for precise entry/exit points.
Indicateur
Prop
Forex
+2
Vision - Advanced Session Indicator
Indicateur
Clarosti a chave para decisões inteligentes no mercado
Indicateur
Forex
The cTrader Market Sessions Alerts Indicator marks global sessions, highlights key levels, and sends real-time alerts.
Indicateur
Project market behavior by integrating price and volume data across multiple time dimensions
Indicateur
Forex
USDJPY
+1
JPYX Indicator with HMA
Indicateur
Coral indicator
Indicateur
Signal
Stocks
+1
The Darvas Box involves identifying "boxes" or trading ranges where a stock's price consolidates before breaking out.
Indicateur
This indicater is a magical impact which shows exactly high and low with 100% results
Indicateur
Grid
Prop
+14
Visualize trends with Standard Deviation Channel! Display median, and add customizable upper/lower deviation channels.
Indicateur
RSI
Signal
+2
Dynamic circles visualize price's volatility position. Like RSI for market overextension & stretch. Quantify context.
Indicateur
ATR
Breakout
Detects swing highs/lows, structure, breakouts, trend lines, and fibs — great for price action trading.
Depuis le 28/01/2026