
Deskripsi
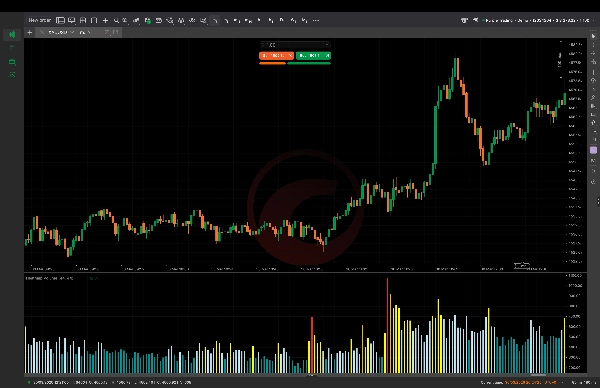
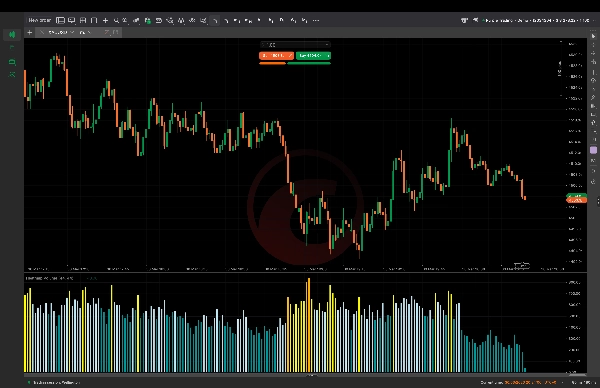
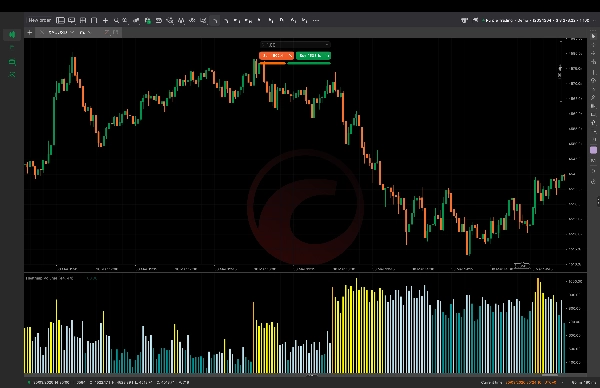
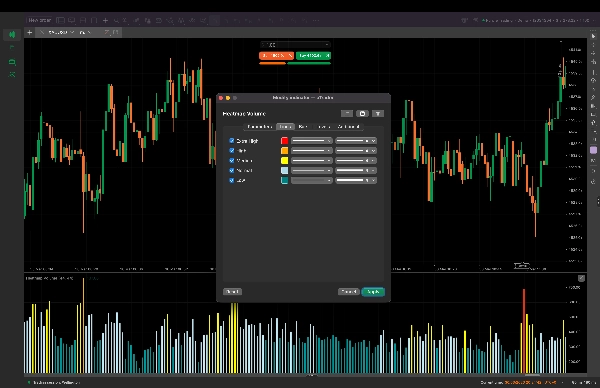
Heatmap Volume adalah indikator trading yang kuat yang dirancang untuk mengungkap aktivitas nyata di balik pergerakan harga dengan menganalisis volume melalui deviasi statistik (Z-score). Alih-alih hanya mengandalkan harga, ini menunjukkan kapan volume secara tidak biasa tinggi atau rendah dibandingkan rata-ratanya—membantu Anda dengan jelas mengidentifikasi keterlibatan uang pintar.
Ini memungkinkan trader untuk langsung melihat partisipasi institusional, momentum kuat, dan potensi jebakan. Zona volume tinggi (kuning, oranye, merah) menyoroti area di mana pemain besar aktif, membantu mengonfirmasi breakout, pembalikan, dan kelanjutan tren. Zona volume rendah (biru, toska) menunjukkan pergerakan lemah, likuiditas rendah, atau breakout palsu—sempurna untuk menghindari perdagangan buruk.
Ini sangat efektif untuk scalping dan trading intraday, di mana keputusan cepat dan akurat sangat penting. Ketika digabungkan dengan alat tren seperti EMA 44, ini menjadi sistem lengkap untuk memfilter perdagangan dengan probabilitas tinggi dan menghindari kebisingan pasar.
🔥 Manfaat Utama:
- Mengidentifikasi pergerakan nyata vs palsu dengan jelas
- Mendeteksi aktivitas institusional (uang pintar)
- Mengonfirmasi breakout kuat dan kelanjutan tren
- Menghindari jebakan volume rendah dan sinyal palsu
- Memfilter pasar sideways (range-bound) dengan mudah
- Fokus hanya pada kondisi pasar yang sedang tren
- Meningkatkan timing masuk dan presisi perdagangan
- Mengurangi overtrading dalam kondisi pasar yang bergejolak
- Bekerja sempurna dengan strategi berbasis EMA
- Heatmap visual yang bersih untuk pengambilan keputusan instan
Apakah Anda seorang scalper atau trader intraday, Heatmap Volume memberi Anda keunggulan yang jelas dengan membantu Anda berdagang hanya ketika pasar memiliki kekuatan nyata—menjauhkan Anda dari kebisingan sideways dan berada di dalam tren yang kuat.
Ringkasan
Ulasan pelanggan
5 | 100 % | |
4 | 0 % | |
3 | 0 % | |
2 | 0 % | |
1 | 0 % |


![Logo "Wyckoff Toolkit [Iridio Capital]"](https://cdn.ctrader.com/image/webp/8acfe6a1-6a8e-4578-9367-9df3af2b1801_27763)


