
Description
Ce que PrometheusSMC analyse
PrometheusSMC lit la structure des prix, le volume et la volatilité sur plusieurs périodes pour identifier où l'activité institutionnelle est la plus susceptible d'influencer le prix. Il traite six couches de données sur chaque barre :
- Structure du marché — sommets/bas de swing (retardés par des barres StructureStrength pour confirmation), BOS (continuation de tendance), et CHoCH (renversement)
- Blocs d'ordres — zones où les ordres institutionnels se sont probablement accumulés, filtrées par un volume dépassant le seuil OB Volume Threshold en écarts-types au-dessus de la moyenne
- Fair Value Gaps — déséquilibres de prix sur 3 chandeliers avec suivi du comblement ; les zones sont supprimées une fois que le prix traverse le corps du gap (pas seulement le bord)
- Balayages de liquidité — détecte quand le prix dépasse un point de swing précédent avant de revenir, le schéma classique de chasse aux stops
- Régime de tendance — croisement EMA combiné avec filtre de volatilité ADX et largeur des bandes de Bollinger pour classer le marché comme en tendance, en range ou choppy
- Contexte de session — identifie les heures de zone morte (07:00 et 11:00 UTC) où les signaux sont atténués pour réduire le bruit
Comment interpréter les signaux et éléments visuels
Flèches et étiquettes :
- Les flèches REV BUY / REV SELL marquent CHoCH (Changement de Caractère) — le premier signe qu'une tendance peut s'inverser
- Les flèches CONT BUY / CONT SELL marquent BOS (Rupture de Structure) — continuation de tendance
- La couleur de la flèche reflète le niveau de qualité du setup : cyan = ÉLEVÉ, vert = BON, violet = MODÉRÉ, bleu ciel = MODÉRÉ, jaune = FAIBLE, gris = MAUVAIS
Zones colorées :
- Les rectangles verts/violets marquent les blocs d'ordres haussiers/baissiers ; les zones s'estompent une fois atténuées
- Les lignes pointillées bleu sarcelle/violet marquent les Fair Value Gaps non comblés ; elles disparaissent une fois que le prix traverse le gap
- Les lignes d'ancrage violet/cyan s'étendent depuis les points CHoCH montrant l'origine du renversement
Niveaux TP/SL :
- TP1 et TP2 utilisent des multiplicateurs fixes depuis l'entrée (par défaut 1,5× et 2,5× le risque)
- TP3 cible le pool de liquidité opposé (point de swing ou bloc d'ordre le plus proche au-dessus/en dessous de l'entrée) — la cible structurelle pour le grand mouvement
- SL est placé à l'extrême du bloc d'ordre avec un tampon multiplicateur configurable
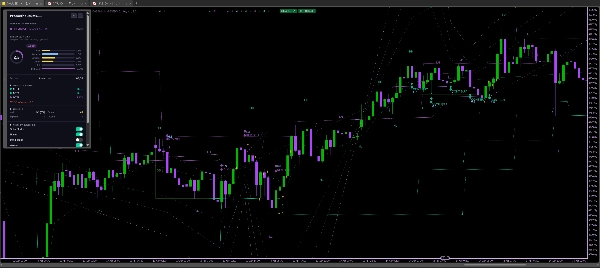
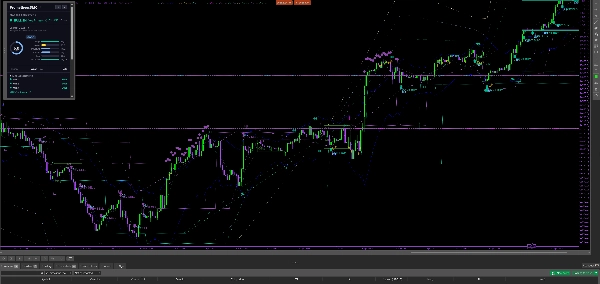
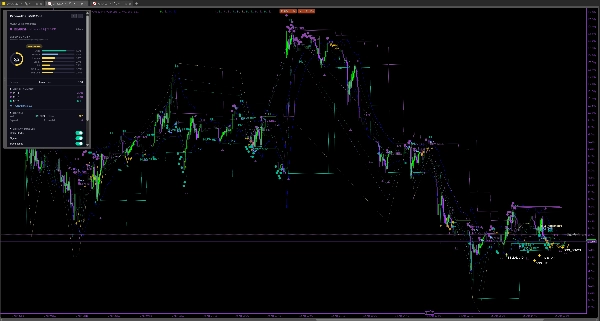
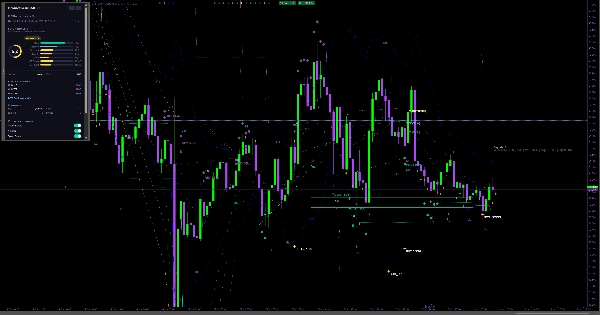
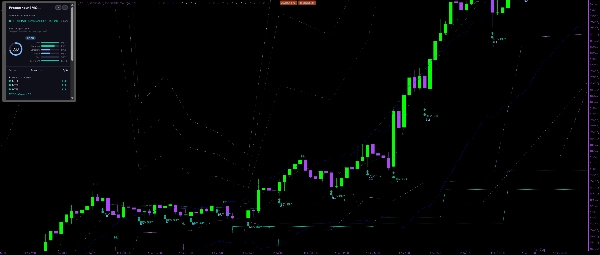
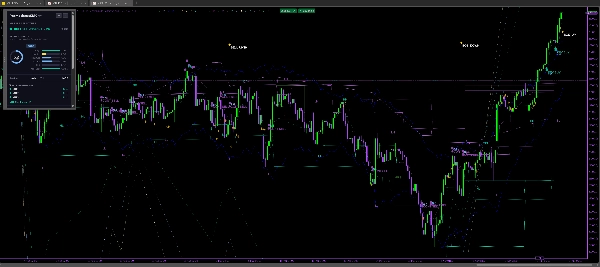
Le tableau de bord affiche la tendance actuelle, le score du setup actif, l'alignement MTF sur trois périodes, le statut de la session, la présence de balayage et de FVG, ainsi que la taille de position calculée en fonction de votre pourcentage de risque sur le compte.
Paramètres clés et réglages
Structure Strength (par défaut : 4) — Barres pour confirmer un point de swing. Plus élevé = moins de ruptures mais plus significatives.
Lookback Period (par défaut : 12) — Barres pour la moyenne de volume et le scan OB.
OB Volume Threshold (par défaut : 1,8σ) — Combien le volume doit dépasser la moyenne pour valider un bloc d'ordre.
Minimum Score for Signal (par défaut : 6, plage : 0-10) — Seuil de qualité. Les signaux ne se déclenchent que lorsque le score composite atteint ce seuil.
Sweep Bonus Weight (par défaut : 1,0) — Combien un balayage de liquidité avant CHoCH augmente le score du setup.
FVG Bonus Weight (par défaut : 0,5) — Combien la proximité d'un FVG non comblé augmente le score du setup.
Sweep Lookback Bars (par défaut : 0 / auto) — Jusqu'où remonter pour chercher des points de swing lors de la vérification des balayages. Auto = Structure Strength × 4. Augmentez à 100-200 sur des périodes plus basses pour attraper les balayages au niveau quotidien.
Enable Structure-Based TP (par défaut : activé) — Lorsqu'activé, TP3 cible le point de swing ou bloc d'ordre opposé au lieu d'un multiplicateur fixe.
MTF1 / MTF2 / MTF3 Timeframes (par défaut : 60 / 240 / 1440 min) — Trois périodes supérieures pour le score d'alignement.
Risk Per Trade % (par défaut : 1,0 %) — Utilisé pour le calcul de la taille de position sur le tableau de bord.
Show Dashboard (par défaut : activé) — HUD sur le graphique avec score, tendance et alignement MTF.
Use WebView Dashboard (par défaut : désactivé) — Tableau de bord HTML étendu avec plus de détails. Nécessite cTrader Desktop sous Windows ou macOS.
Cas d'utilisation typiques
Scalping sur 1-5m avec contexte structurel : Réglez Structure Strength à 2-3 pour des signaux plus rapides, baissez Minimum Score for Signal à 5, et utilisez le MTF 60m pour le biais. La heatmap de conviction vous permet d'éviter les entrées de faible qualité d'un coup d'œil.
Intraday sur 15m : Les réglages par défaut fonctionnent bien. Surveillez les flèches CHoCH avec bonus de balayage (cyan/vert) pendant les sessions de Londres ou New York. Prenez TP1 rapidement, laissez TP3 courir jusqu'au pool de liquidité opposé.
Swing sur 1H/4H : Augmentez Structure Strength à 5-6 pour des ruptures structurelles significatives. Réglez Sweep Lookback Bars à 200+ pour attraper les balayages des hauts/bas hebdomadaires. Augmentez Minimum Score for Signal à 7-8 pour moins d'entrées mais de meilleure qualité.
Filtre de confluence : Activez l'alignement MTF et exigez qu'au moins 2 des 3 périodes soient en accord avec la direction du signal avant d'entrer.
Pour qui cet indicateur est-il le mieux adapté
PrometheusSMC est conçu pour les traders qui comprennent déjà les concepts Smart Money (blocs d'ordres, Fair Value Gaps, balayages de liquidité, structure du marché) et souhaitent un système cohérent et basé sur des règles pour identifier et scorer les setups. Ce n'est pas un
service de signaux plug-and-play — le scoring de qualité nécessite que vous compreniez ce que signifient les composants et que vous les ajustiez à votre instrument et votre période.
Niveau d'expérience : Intermédiaire à avancé. Les débutants peuvent l'utiliser pour apprendre le SMC en observant comment la structure, les OB et les FVG interagissent, mais devraient d'abord trader en démo et étudier la répartition du scoring avant de risquer du capital.
Style de trading : Traders intraday et swing sur forex, indices (US30, NAS100) et or (XAUUSD). Les scalpers peuvent l'utiliser avec une force de structure réduite. Il inclut des préréglages pour XAUUSD, US30, NAS100 et les principales paires forex.
Limitations importantes et notes d'utilisation
- Non-repeint : Les séries de sortie (flèches, étiquettes, zones) n'apparaissent que sur des barres confirmées. La barre en direct met à jour le scoring interne de manière réactive, mais l'état structurel (points de swing, direction de tendance, blocs d'ordre, FVG) ne se valide qu'à la clôture de la barre. Cela signifie
que la dernière barre de votre graphique peut se déplacer au fur et à mesure que le prix évolue — c'est un comportement attendu et correct
- Pas de rentabilité garantie : PrometheusSMC identifie la structure et score la confluence ; il ne prédit pas la direction. Tout setup peut échouer. Utilisez toujours une gestion des risques appropriée et ne risquez jamais plus que ce que vous pouvez vous permettre de perdre
- Le tableau de bord WebView nécessite cTrader Desktop sous Windows ou macOS. Il ne s'affichera pas sur cTrader Web ou Mobile. Le tableau de bord sur graphique fonctionne sur toutes les plateformes
- Les instruments préréglés (XAUUSD, US30, etc.) ajustent la force de structure, les périodes EMA et les seuils OB pour chaque marché. Si votre instrument ne figure pas dans la liste des préréglages, commencez avec les valeurs par défaut et ajustez à partir de là
- Les performances historiques affichées par tout backtest ou relecture de graphique ne garantissent pas les résultats futurs. Les signaux passés visibles sur le graphique peuvent sembler meilleurs qu'ils ne l'étaient en temps réel en raison de la nature de la sortie uniquement sur barres confirmées


