说明
忘记那些使您的图表杂乱无章且消耗过多系统资源的过载成交量剖面指标。
多年来,我使用过许多不同的成交量剖面指标,并在它们上花费了大量资金。但没有一个能提供我所寻找的简洁与质量的平衡,因此我决定构建自己的方法。
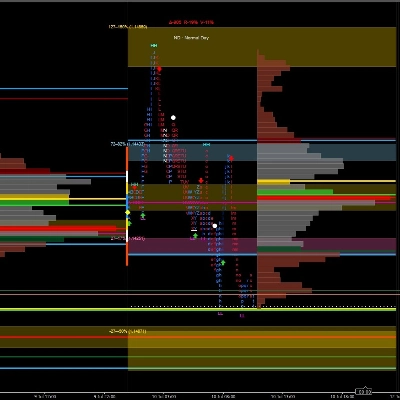
当您将指标添加到图表时,只会出现一条垂直线。这条线代表计算开始的蜡烛。指标会自动检测所选蜡烛之后的最高/最低点,并用于动态确定剖面范围边界。直方图连同POC / VAH / VAL水平会即时生成。
您唯一需要做的就是将起始线拖动到您想要的蜡烛上,并在必要时从输入设置中定义持续分钟限制。由于该线像磁铁一样吸附在蜡烛上,几乎不可能出现错误对齐或误用。
就是这么简单。
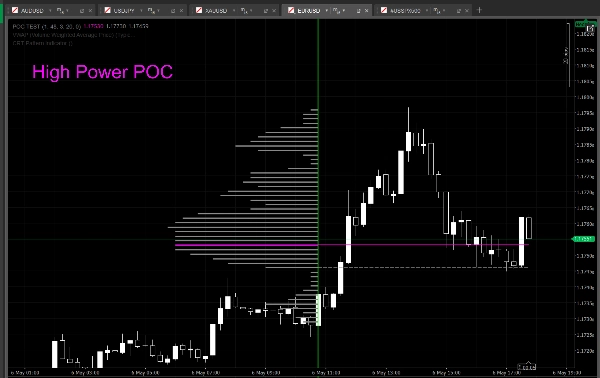
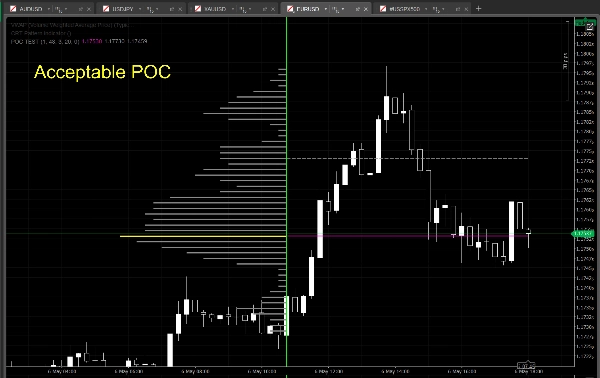
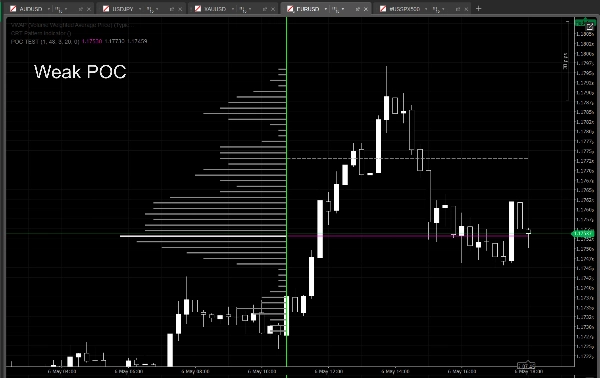
对应POC的直方图线使用三种不同颜色来表示POC强度:
- 白色 → 弱POC
- 黄色 → 可接受/平衡的POC
- 品红色 → 强POC
重要提示:
起始线所在的蜡烛不包含在计算中。剖面从所选蜡烛之后的下一根蜡烛开始。
您可以通过使用不同的实例ID值,在同一图表上创建多个独立的剖面。
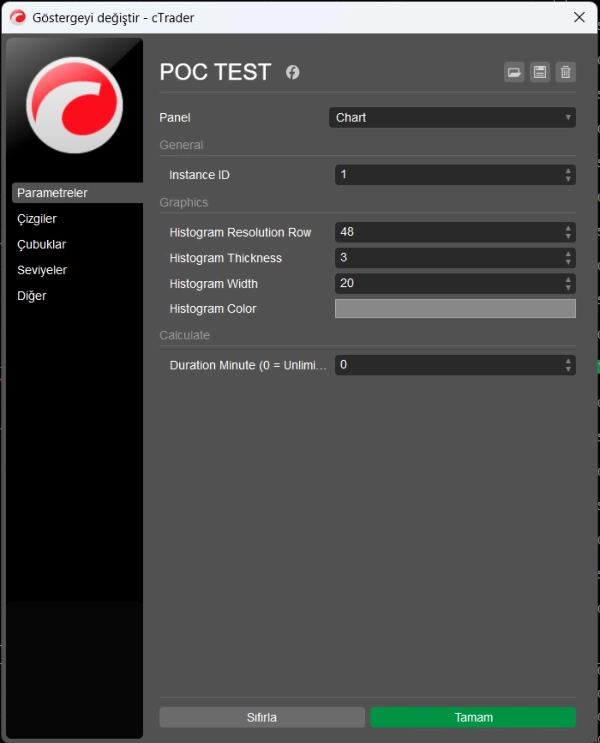
参数结构被刻意保持简单。没有几十个不必要的设置,只有必要的控制。尽管外观简洁,指标在后台运行着高度精细的计算引擎。
内部使用的一些计算方法:
- 混合加权成交量分布
- 收盘价偏差计算
- 蜡烛实体加权
- 扫掠/影线过滤逻辑
- 基于簇的POC检测
- 动态POC强度分析
- 自适应价值区扩展
- 稳定的VAH / VAL计算
- 降噪直方图生成
- 低开销实时重新计算
注意:
- 为了简化和稳定,参数集被刻意限制。需要更高级定制选项的用户可以直接联系我。未来可能会为他们发布专门的高级版本。
摘要
AI 摘要
Easy Volume Profile is a volume profile indicator designed for simplicity and efficiency. It displays a single vertical line on the chart that marks the starting candle for the profile calculation. The indicator automatically detects the high and low points from the candle following the start line to define the profile range. It then generates a volume histogram along with key levels: Point of Control (POC), Value Area High (VAH), and Value Area Low (VAL).
Users can drag the start line to select the desired candle, with an optional duration limit setting. The line snaps to candles to prevent misalignment. Multiple independent profiles can be created on the same chart using different instance IDs.
The POC line uses three colors to indicate strength: white for weak, yellow for balanced, and magenta for strong POC. Internally, the indicator employs advanced calculation methods including hybrid weighted volume distribution, close-price bias, candle body weighting, wick filtering, cluster-based POC detection, dynamic POC strength analysis, adaptive value area expansion, stabilized VAH/VAL calculation, noise-reduced histogram generation, and low-overhead real-time recalculation.
The parameter set is minimal, focusing on essential controls to maintain a clean chart appearance without excessive resource consumption. This indicator supports visualization of volume profiles with key market structure levels for enhanced volume-based analysis.
指标配置
指标分类
交易量
输出类型
可视化
信号
过滤器
数据要求
跳动点数据
交易量
外部数据
仅 K 线
市场深度
支持的信号
突破
反转
波动性
触及水平位
突破水平位
趋势强度
交叉
背离
客户评价
0.0
评价:0
客户评价
该产品尚无评价。已经试过了?抢先告诉其他人!
讨论
常见问答
Fair Value Gap
Key Levels
BOS
Volume
CHOCH
Market Structure
Supply & Demand
cTrader Store 提供的所有产品,包括交易机器人、指标和插件,均由第三方开发者提供,仅供信息参考和技术访问之用。cTrader Store 并非经纪商,不提供投资建议、个人推荐或任何未来业绩保证。