
Description
Cet indicateur analyse la première bougie de 4 heures de chaque jour de trading pour établir une plage de prix quotidienne. Il identifie le plus haut, le plus bas et la clôture de la bougie 4H précédente — trois niveaux clés que les traders institutionnels et les algorithmes consultent intensivement au début de chaque session. Il analyse également la structure des oscillations de 15 minutes pour déterminer le biais actuel du marché. Cet indicateur peut être utilisé sur n'importe quel marché, de préférence les indices.
Comment interpréter les signaux et les éléments visuels
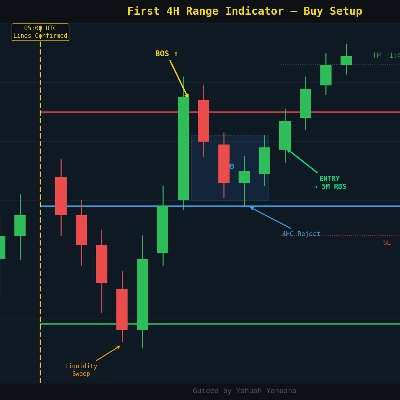
- Ligne horizontale rouge — le plus haut de la première bougie 4H. Sert de limite supérieure de la plage quotidienne et de niveau potentiel de résistance
- Ligne horizontale verte — le plus bas de la première bougie 4H. Sert de limite inférieure et de support potentiel
- Ligne horizontale bleue (4HC) — la clôture de la bougie 4H précédente, indiquant où le prix se situait au début de la nouvelle journée. Sert souvent de niveau de liquidité intermédiaire
- Ligne verticale dorée — marque la barre exacte où tous les niveaux ont été confirmés, facilitant la visualisation du moment où la plage a été définie
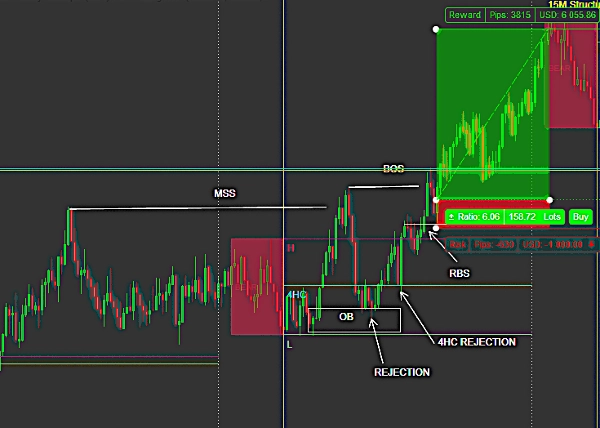
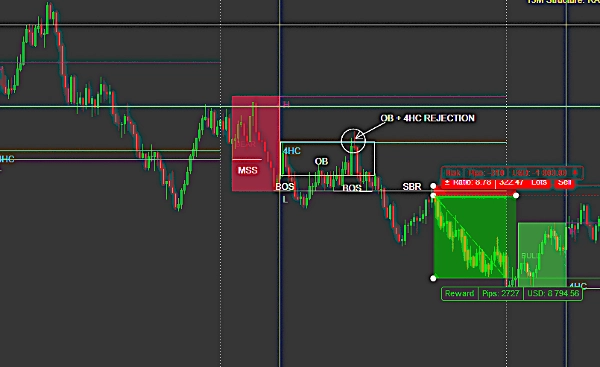
- Panneau de structure 15M — affiche un biais haussier, baissier ou neutre basé sur les récents sommets et creux des oscillations, avec les étiquettes HH/HL/LH/LL tracées sur le graphique
Toutes les lignes apparaissent solides et verrouillées dès la clôture de la première bougie 4H. Rien ne se repeint ni ne bouge après confirmation.
Paramètres clés et réglages
- Nombre maximal de jours d'historique — contrôle le nombre de jours passés dont les niveaux sont affichés
- Afficher la clôture 4H à l'ouverture du jour — active ou désactive la ligne bleue 4HC
- Afficher la ligne dorée du début de journée — active ou désactive la ligne verticale dorée
- Afficher les marqueurs verticaux — marques de tick limitées aux bornes de la plage pour référence visuelle
- Biais de structure 15M — active les étiquettes d'oscillation et le panneau de biais (graphique 5M uniquement)
- Rétroaction d'oscillation / Nombre d'oscillations — contrôle la sensibilité de la détection de structure
- Personnalisation complète de la couleur, de l'épaisseur et du style de ligne pour chaque élément
Cas d'utilisation typiques et scénarios de trading
- Utiliser les niveaux H et L comme plage quotidienne pour rechercher des retournements ou des cassures pendant les killzones (ouverture de Londres/NY)
- Utiliser le niveau 4HC comme objectif intermédiaire ou niveau d'entrée de confluence
- Combiner la plage avec les cadres SMC, ICT ou CRT pour des configurations à haute probabilité
- Vérifier le panneau de biais 15M avant de prendre une entrée 5M pour assurer l'alignement structurel
À qui cet indicateur est-il le mieux adapté
Traders intraday intermédiaires à avancés qui utilisent la plage d'ouverture quotidienne comme référence structurelle. Particulièrement adapté aux traders utilisant les concepts Smart Money (SMC), ICT ou des méthodologies similaires. Fonctionne sur toutes les unités de temps mais s'associe mieux avec le 5M ou 1M pour une précision d'entrée.
Limitations importantes et notes d'utilisation
- Les niveaux n'apparaissent qu'après la clôture de la première bougie 4H de la journée — aucun niveau n'est affiché tant que cette bougie est en formation
- Le moment exact où les niveaux apparaissent dépend de l'alignement des bougies 4H de votre courtier. Sur Deriv, la première bougie 4H s'ouvre à 01:00 UTC et se ferme à 05:00 UTC
- Le panneau de biais de structure 15M est limité au graphique 5M uniquement
- Pour une meilleure performance de défilement, désactivez la ligne verticale dorée ou réduisez le nombre maximal de jours d'historique en cas de latence


![Logo de "[Stellar Strategies] Market Session Ultimate"](https://cdn.ctrader.com/image/webp/61ffd537-0125-4246-9e72-42eca1791d64_28232)















