
Description
ICCandle pour cTrader
Découvrez ce qui s'est passé la dernière fois que ce graphique ressemblait à ceci — sans quitter cTrader.
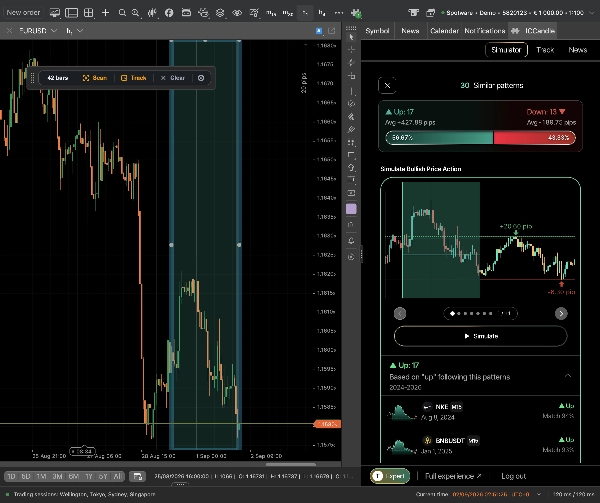
ICCandle est un plugin de recherche de motifs et de réaction aux actualités. Sélectionnez une plage de barres sur votre graphique et ICCandle recherche dans son index historique les moments qui y ressemblaient le plus parmi 50 instruments. Les correspondances apparaissent dans un panneau ancré à l'intérieur de cTrader, et tout ce que vous cliquez là-bas est dessiné sur votre graphique natif : les barres du motif correspondant, une projection animée de la façon dont le prix a évolué après ces correspondances, et — côté actualités — des lignes d'événements avec le vrai plus haut, plus bas et la réaction en pips après la publication.
La recherche et le graphique à partir duquel vous tradez restent sur le même écran.
Ce que le plugin ajoute
Barre d'outils du scanner de graphique — Une petite carte déplaçable sur le graphique. *Sélectionner la plage* dépose un rectangle redimensionnable sur les barres récentes qui s'ajuste aux chandeliers entiers. Scanner télécharge exactement ces chandeliers et renvoie des correspondances historiques classées. *Suivre* transforme la même sélection en une alerte permanente.
Relecture de chandeliers fantômes — Choisissez une correspondance et le plugin anime les chandeliers *suivants* de cette correspondance à partir de votre barre actuelle, un toutes les 150 ms. La projection est redimensionnée selon la volatilité locale (taille médiane du corps du motif par rapport à vos ~50 dernières barres, ancrée sur la clôture actuelle), donc une correspondance d'une session calme de 2019 n'est pas dessinée à l'amplitude de 2019 sur le graphique d'aujourd'hui. Si la projection ne rentre pas, le graphique effectue d'abord un zoom arrière, puis joue.
Superpositions d'actualités économiques — La vue Actualités dessine des lignes d'événements verticales avec des étiquettes de devises. Cliquez sur un événement déjà publié et vous obtenez des boîtes d'impact post-événement sur le graphique : haut, bas, milieu, et le mouvement en pips. Cliquez sur un événement à venir et les barres environnantes sont envoyées au panneau pour contexte.
Suivi de motif — Enregistrez la forme sélectionnée comme une alerte surveillée sur des symboles, des périodes et une fenêtre de session choisies, pour qu'elle vous trouve au lieu que vous la cherchiez.
Superpositions de motifs — Tout motif que vous sélectionnez dans le panneau, classique ou personnalisé, est mis en évidence sur le graphique natif, verrouillé pour ne pas être déplacé.
Comment il s'intègre à votre flux de travail
Il se place avant le ticket d'ordre, à l'étape « ce setup vaut-il la peine d'être pris ».
1. Activez ICCandleEmbed sous Algo → Plugins, puis cliquez sur le bouton ICCandle dans la barre d'outils du graphique. Le panneau s'ouvre à droite ; la barre d'outils du scanner apparaît sur le graphique.
2. Connectez-vous une fois à l'intérieur du panneau. La session persiste, donc les redémarrages sautent cette étape.
3. Vous repérez une formation. Tracez la plage dessus et cliquez sur Scanner.
4. Lisez les correspondances classées, cliquez dessus, et regardez les conséquences de chacune se dérouler sur votre graphique en direct à votre propre volatilité.
5. Agissez dessus dans le ticket cTrader normal, ou cliquez sur Suivre et laissez-le vous alerter la prochaine fois.
Autour des actualités, le flux s'inverse : ouvrez l'onglet Actualités, voyez ce qui est prévu, puis cliquez sur une instance passée de la même publication pour voir jusqu'où cette paire a réellement bougé.
Le panneau et le graphique restent synchronisés automatiquement. Changer d'onglet dans le panneau affiche ou masque le scanner et efface les superpositions qui ne s'appliquent plus, et le panneau connaît toujours la période actuelle de votre graphique.
Cas d'utilisation typiques
Confirmer un setup discrétionnaire. Vous voyez un double creux sur EURUSD 1H. Scannez-le. Trente ressemblances historiques qui ont majoritairement résolu à la hausse est un trade très différent d'un partage 50/50. La relecture montre la forme et l'échelle des conséquences typiques, pas seulement un taux de réussite.
Dimensionner un trade d'actualité. Avant NFP ou une publication CPI, consultez les publications passées et lisez les boîtes d'impact : cette paire parcourt typiquement N pips dans la fenêtre de réaction. C'est une entrée pour la distance du stop et la cible, pas un appel de direction.
Jugement de la validité d'une cassure. Sélectionnez la consolidation plus la barre de cassure et scannez. Les correspondances qui ont immédiatement retracé vous disent quelque chose que le graphique seul ne montre pas.
Recherche de motifs inter-marchés. Configurez les symboles sur toute votre liste de surveillance au lieu du graphique actuel et laissez le scan trouver l'instrument qui forme la forme que vous aimez.
Surveillance passive. Tout motif que vous tradez régulièrement est ajouté au tracker avec votre fenêtre de session attachée.
À qui s'adresse-t-il
Convient mieux aux traders discrétionnaires et semi-systématiques de niveau intermédiaire ou supérieur — traders qui lisent déjà l'action des prix, ont déjà un setup qu'ils tradent, et veulent des taux de base historiques pour cela plutôt qu'un signal à suivre aveuglément.
Particulièrement adapté pour :
- Traders d'action des prix et de motifs sur forex, or, indices ou crypto
- Traders d'actualités et d'événements qui ont besoin de données de taille de réaction plutôt que de prévisions
- Horizons intraday à swing, de 15M à quotidien
- Toute personne faisant des recherches manuelles « laissez-moi revenir en arrière et trouver des setups similaires » — ceci remplace des heures de cela
Moins adapté pour : les débutants qui n'ont pas encore formé de stratégie à tester, les scalpers travaillant en dessous de 15 minutes, et les traders cherchant une exécution entièrement automatisée.
Limitations et notes d'utilisation
- Il ne trade pas. Aucun ordre n'est passé, aucune position modifiée, aucune donnée de compte lue. Analyse et visualisation uniquement — chaque décision d'exécution reste la vôtre.
- Un compte ICCandle et une connexion internet sont requis. Le panneau, l'index des motifs et les données d'actualités sont tous servis depuis le backend d'ICCandle.
- Les scans nécessitent une résolution de 15 minutes ou plus. L'index ne contient rien en dessous de 15M, donc le scanner utilise par défaut 15M quelle que soit la période de votre graphique.
- Seuls les 50 instruments indexés peuvent être scannés ou suivis. Votre broker en propose plus ; les symboles hors catalogue sont filtrés dans les sélecteurs plutôt que de retourner silencieusement zéro correspondance.
- La taille de sélection est imposée : 10–100 barres, multiples de 10 au-dessus de 50.
- Verrouillage par plan. Le nombre de correspondances et le modèle dépendent de votre abonnement ICCandle — Gratuit 30, Standard 50, Pro 100, Expert 200 correspondances ; les modèles Standard, Plus et Pro nécessitent un plan Pro ou Expert. Les options au-dessus de votre plan restent visibles avec un indice de mise à niveau. Une recherche de plan échouée est traitée comme Gratuit.
- Les chandeliers fantômes sont des analogues historiques, pas des prévisions. Ils montrent comment le prix s'est comporté après des barres similaires dans le passé, redimensionnés à la volatilité d'aujourd'hui. Des formes similaires ne signifient pas le même contexte — régime, spread, session et événements à venir diffèrent tous. Traitez-les comme une entrée parmi votre propre analyse, jamais comme une prédiction.
- Un panneau par instance. Cliquer sur le bouton de la barre d'outils reconstruit le panneau à partir de zéro, et le fermer efface toutes les superpositions qu'il a dessinées.
- Nécessite les droits d'accès complet, car le plugin effectue des appels HTTPS sortants vers les services d'ICCandle.
- cTrader Desktop sur macOS et Windows.
- Les sessions d'actualités utilisent leurs horloges de marché domestique (New York 09:30–16:00 ET, Londres 08:00–16:30 UK, Tokyo 09:00–15:00 JST, Sydney 10:00–16:00 AEST). Les fenêtres personnalisées sont envoyées avec le fuseau horaire que vous spécifiez, donc rien n'est converti silencieusement.
Résumé
Key features include:
- A chart scanner toolbar for selecting bar ranges and scanning historical matches or setting alerts.
- Ghost-candle replay that animates the price movement following matched patterns, scaled to current market volatility.
- Economic-news overlays displaying event lines with post-release price impact metrics.
- Pattern tracking to monitor specific shapes across symbols, timeframes, and session windows.
- Pattern overlays that highlight selected matches on the chart without altering their position.
The plugin integrates seamlessly into the trader’s workflow, providing historical context before order execution. It supports 15-minute resolution or higher and requires an ICCandle account with internet access. ICCandlePlugin operates solely as an analytical tool without placing trades or accessing account data. It is suitable for intermediate or advanced traders focusing on price action, pattern recognition, and news reaction across forex, gold, indices, and crypto markets.




![Logo de "Custom Timeframes [Iridio Capital]"](https://cdn.ctrader.com/image/webp/4d75a920-23c7-4fea-a7b5-594a9d067f2e_63286)