Description
Indicateur de Regroupement
Présentation
L'indicateur de regroupement est un outil puissant conçu pour aider les traders à identifier des motifs, des tendances et des anomalies dans les données du marché. En regroupant des points de données similaires en clusters, cet indicateur fournit des informations précieuses qui peuvent être utilisées pour prendre des décisions de trading éclairées.
Fonctionnalités
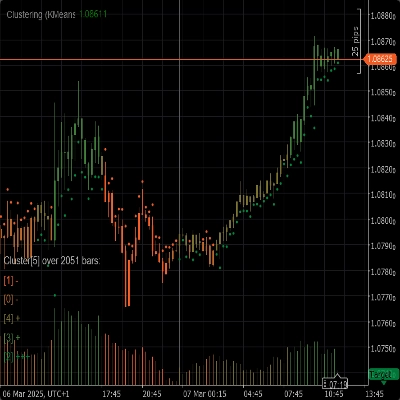
- Algorithmes de Regroupement : Utilise des algorithmes de regroupement avancés tels que K-Means et le Modèle de Mélange Gaussien (GMM) pour segmenter efficacement les données du marché.
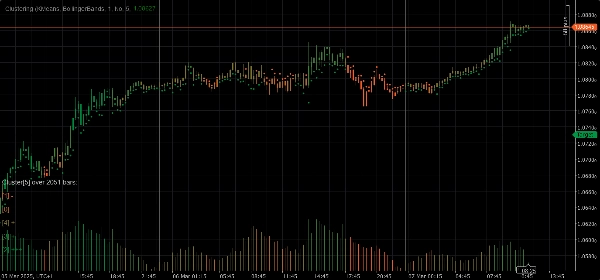
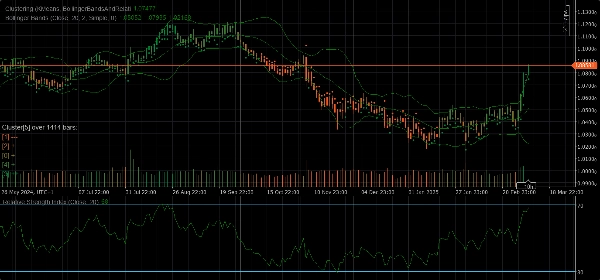
- Ensembles de Caractéristiques : Offre une variété d'ensembles de caractéristiques incluant le Prix Brut, les Bandes de Bollinger, l'Indice de Force Relative (RSI), l'Oscillateur Stochastique, les Bandes de Bollinger et RSI, ainsi que des combinaisons de ces indicateurs pour capturer différents aspects du comportement du marché.
- Regroupement Dynamique : Détermine automatiquement le nombre optimal de clusters garantissant que le regroupement soit aussi précis que possible.
- Visualisation : Fournit des aperçus visuels clairs des mouvements des clusters et de la volatilité directement sur votre graphique.
Paramètres
- Algorithme de Regroupement : Choisissez entre K-Means ou Modèle de Mélange Gaussien (GMM) pour mieux adapter votre stratégie de trading.
- Ensemble de Caractéristiques : Sélectionnez parmi Prix Brut, Bandes de Bollinger, RSI, Oscillateur Stochastique, Bandes de Bollinger et RSI, ou un ensemble complet de données de marché incluant divers indicateurs.
- Fenêtre : Définissez le nombre de barres à considérer pour chaque point de données.
- Auto K : Déterminez automatiquement le nombre de clusters en fonction de vos données.
- K Initial : Définissez un nombre initial de clusters si Auto K est désactivé.
- Nombre Maximal de Barres Historiques : Limitez le nombre maximal de barres historiques utilisées pour le regroupement. Si réglé à 0, toutes les barres disponibles sont utilisées.
- Colorer par Clusters : Activez ou désactivez le recoloriage du graphique basé sur les affectations réelles des clusters.
- Afficher les Informations : Affichez des informations détaillées sur chaque cluster directement sur le graphique.
- Afficher les Indicateurs : Affichez les indicateurs utilisés dans les ensembles de caractéristiques.
Paramètres d'Adaptation Automatique
- Adaptation Automatique : Activez ou désactivez le mode d'adaptation automatique, qui permet à l'indicateur de réinitialiser les clusters selon des conditions spécifiées.
- Heure d'Adaptation Automatique : L'heure de la journée à laquelle l'adaptation automatique peut se produire (0-23).
- Période d'Adaptation Automatique : Le nombre minimum d'heures qui doivent s'écouler depuis la dernière adaptation avant qu'une nouvelle adaptation puisse avoir lieu.
Paramètres des Ensembles de Caractéristiques
Paramètres des Bandes de Bollinger
- Période : La période pour le calcul des Bandes de Bollinger.
- Déviation : Le multiplicateur d'écart-type pour les Bandes de Bollinger.
- Type de Moyenne Mobile : Le type de moyenne mobile utilisé dans le calcul des Bandes de Bollinger (Simple, Exponentielle, etc.).
Paramètres de l'Indice de Force Relative (RSI)
- Période : La période pour le calcul du RSI.
Paramètres de l'Oscillateur Stochastique
- Période : La période K pour l'Oscillateur Stochastique.
- Ralentissement K : Le facteur de ralentissement K pour l'Oscillateur Stochastique.
- Période D : La période D pour l'Oscillateur Stochastique.
- Type de Moyenne Mobile : Le type de moyenne mobile utilisé dans le calcul de l'Oscillateur Stochastique (Simple, Exponentielle, etc.).
- Type de Calcul : Le type de calcul pour l'Oscillateur Stochastique (LowHigh, CloseClose, etc.).
Utilisation
1. Ajoutez l'Indicateur de Regroupement à votre graphique.
2. Configurez les paramètres selon votre stratégie de trading.
3. Analysez les clusters et leurs mouvements sur le graphique.
4. Utilisez les informations fournies par l'indicateur pour prendre des décisions de trading éclairées.
Résumé
Avis clients
5 | 50 % | |
4 | 50 % | |
3 | 0 % | |
2 | 0 % | |
1 | 0 % |


![Logo de "Gaussian Channel [Iridio Capital]"](https://cdn.ctrader.com/image/webp/7c039209-5573-4a54-a072-f9528b503103_41960)


