Descrizione
⚠️ Ci siamo spostati su 👉 PrimeQuant
🚫🚫🚫 Non acquistare questo indicatore!
Questo OHLC PRO di LudwigICT è un strumento multi-funzione di sovrapposizione grafica progettato per fornire una visualizzazione professionale e ricca di informazioni sul tuo grafico cTrader.
Ecco una panoramica di cosa fa:
🔹 Funzione principale: Sovrapposizione OHLC
- Disegna barre OHLC personalizzate (Open, High, Low, Close) sul tuo grafico.
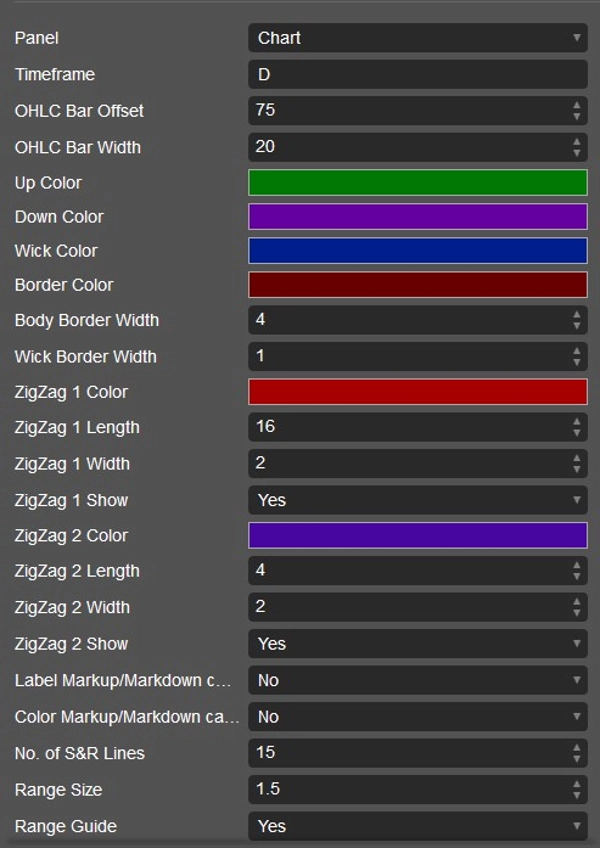
- Puoi impostare:
-
- Quale timeframe OHLC utilizzare (Daily, Weekly, Monthly, o intraday come H1, M15, ecc.).
- Offset della barra (distanza dalle candele correnti).
- Larghezza della barra, stoppini, bordi e colori personalizzati.
- In pratica, ottieni “candele di riferimento” da timeframe superiori posizionate sul tuo grafico attuale.
🔹 Configurazione Triple-M (Segnali rialzisti/ribassisti)
- Rileva un modello di minimi crescenti consecutivi (rialzista) o massimi decrescenti (ribassista).
- Quando rilevato:
-
- Può posizionare icone a triangolo (su o giù) sulle candele.
- Può anche ricolorare le barre per mostrare il cambiamento di momentum.
- Questo agisce come un segnale di cambiamento nella struttura del momentum.
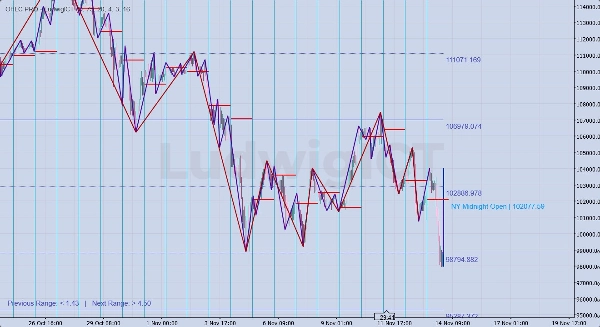
🔹 Strumenti Dual ZigZag
- Due sovrapposizioni ZigZag indipendenti:
-
- ZigZag #1 (lunghezza maggiore, es. struttura swing).
- ZigZag #2 (lunghezza minore, es. micro swing).
- Evidenzia i movimenti di mercato per analisi di struttura, trend e breakout.
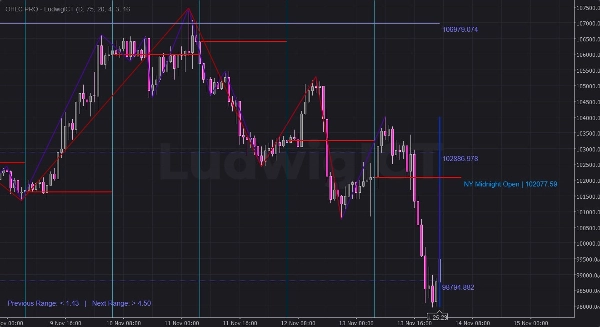
🔹 Supporti e Resistenze di Gann
- Utilizza una tabella di numeri di Gann + logica ATR per calcolare i livelli di S/R.
- Traccia multiple linee di supporto/resistenza sopra e sotto il prezzo.
- Le linee possono essere stilizzate (solide, tratteggiate, estese a sinistra, ecc.).
- Etichetta i livelli con i valori di prezzo.
- Fornisce anche Guide di Range:
-
- “Range Precedente” vs. “Range Successivo” relativo all’ATR.
- Aiuta a prevedere zone di espansione o contrazione.
🔹 Livelli di Mezzanotte di New York
- Rileva automaticamente il prezzo di apertura a mezzanotte della sessione di New York.
- Disegna:
-
- Linea orizzontale al prezzo di apertura a mezzanotte di NY.
- Linea verticale all’inizio della sessione.
- Etichette che mostrano “NY Midnight Open | prezzo”.
- Puoi estendere queste linee per 1 o 2 giorni, o aggiungere ore extra.
- Utile per il trading in stile ICT (bias della sessione di New York, punti di equilibrio, ecc.).
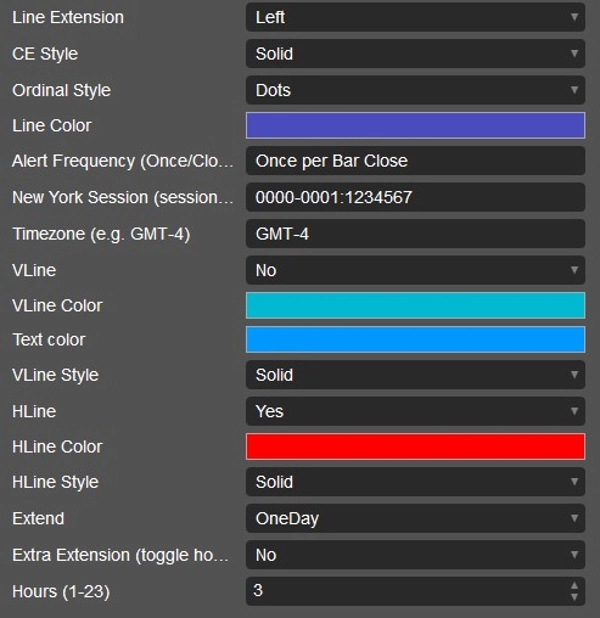
🔹 Personalizzazione e Avvisi
- Ogni funzione ha parametri nei menu a tendina:
-
- Colori, stili, estensioni delle linee, numero di linee, ecc.
- Gli avvisi sono supportati (anche se principalmente tramite elementi visivi sul grafico—il parametro di frequenza degli avvisi è presente).
- Rimozione pulita alla chiusura dell’indicatore (così il tuo grafico non rimane ingombro).
✅ In breve:
Questo indicatore è uno strumento multiuso per l’azione del prezzo. Combina:
- Candele OHLC di timeframe superiori
- Segnali di pattern di momentum (Triple-M)
- Due strutture ZigZag
- Livelli S/R di Gann + guide di range
- Indicatori di apertura a mezzanotte della sessione di New York
È progettato per il trading basato su struttura, sessione e livelli, particolarmente utile per trader in stile ICT o di price action.
Spiego come potresti usarlo praticamente nel trading su XAU/USD
🔹 Uso pratico nel trading (Oro con OHLC PRO)
1. Sovrapposizione OHLC di timeframe superiore
- Esempio: Traccia OHLC giornaliero mentre fai trading su M5/M15.
- Vedrai la candela di ieri “dentro” il tuo grafico intraday.
- Uso:
-
- Prezzo che si avvicina a massimo/minimo del giorno precedente = area di caccia alla liquidità.
- Apertura/chiusura giornaliera = filtro di bias (sopra = rialzista, sotto = ribassista).
- Ti aiuta a fare trading all’interno del range giornaliero.
👉 Sull’oro, la sessione di NY spesso attacca il massimo/minimo del giorno precedente prima di invertire.
2. Segnali Triple-M
- Il pattern Triple-M (serie di minimi crescenti o massimi decrescenti) = momentum a breve termine.
- Uso:
-
- Triple-M rialzista vicino a supporto (minimo HTF o apertura a mezzanotte di NY) → possibile scalp long.
- Triple-M ribassista vicino a resistenza (massimo HTF o livello di Gann) → possibile scalp short.
- Può colorare le barre per un rapido riconoscimento visivo nei movimenti veloci dell’oro.
👉 Funziona bene per entrate da cecchino su M1–M5 quando allineate con il bias HTF.
3. Dual ZigZag
- ZigZag #1 (lunghezza maggiore) = struttura swing.
- ZigZag #2 (lunghezza minore) = micro struttura.
- Uso:
-
- Identifica rotture della struttura di mercato (BOS/CHOCH).
- Fai trading solo nella direzione del ZigZag più grande (#1).
- Usa il ZigZag più piccolo (#2) per la conferma dell’entrata.
👉 Esempio: bias giornaliero rialzista → aspetta lo spostamento rialzista del ZigZag #2 vicino al supporto HTF.
4. Supporti e Resistenze di Gann
- Genera una griglia di livelli matematici di S/R.
- Uso:
-
- Se il prezzo è in consolidamento, i livelli indicano probabili punti di breakout di espansione.
- Combina con la guida di range ATR:
-
- “Range Precedente” piccolo → aspettati espansione della volatilità.
- “Range Successivo” alto → forte livello di breakout in arrivo.
👉 Sull’oro, i livelli di Gann spesso si allineano con numeri tondi (es. 2400, 2420, 2435).
5. Apertura a Mezzanotte di New York
- Questo è uno degli strumenti ICT più potenti per l’oro.
- Uso:
-
- Prezzo relativo all’apertura a mezzanotte di NY = bias direzionale.
- Se il prezzo rimane sopra l’apertura a mezzanotte → sessione NY rialzista.
- Se sotto → bias ribassista.
- La linea orizzontale funge da riferimento di equilibrio (50%).
- Osserva le spazzate di liquidità intorno a questo livello nelle killzone di Londra/NY.
👉 Esempio:
Apertura a mezzanotte di NY = 2405.
- Se Londra spinge il prezzo a 2398 e NY riconquista 2405 → setup long forte.
🔑 Metterlo insieme (Esempio di setup)
- Inizio sessione NY:
-
- Traccia OHLC giornaliero.
- Nota l’apertura a mezzanotte di NY.
- Osserva i livelli di Gann nelle vicinanze.
- Aspetta il grab di liquidità (raid del massimo/minimo giornaliero o SR di Gann).
- Controlla Triple-M / ZigZag #2 per conferma micro rialzista/ribassista.
- Entra con stop dietro la spazzata di liquidità.
- Target lato opposto del range o prossimo livello Gann/HTF.
✅ In breve:
- OHLC giornaliero + Mezzanotte NY = filtro di bias.
- ZigZag + Triple-M = tempistica di entrata.
- Gann + Guida di Range = obiettivi di profitto e segnali di espansione.
Questo indicatore ti offre fondamentalmente tutti gli strumenti in stile ICT in un unico pacchetto per XAU/USD.
Se hai domande o riscontri problemi, non esitare a contattarmi. Sono felice di aiutarti!
Disclaimer:
Utilizzando i miei algoritmi, riconosci che il trading comporta rischi intrinseci e che le performance passate non garantiscono risultati futuri. È essenziale avere una solida strategia di gestione del rischio e, soprattutto, rimanere disciplinati nel rispettare i livelli di stop-loss. La mancata gestione corretta del rischio può portare a perdite significative. Non sono responsabile per eventuali risultati finanziari derivanti dall’uso di questi algoritmi. Fai trading responsabilmente e segui sempre le corrette pratiche di gestione del rischio.
Bless up! 🙌
Riepilogo
Recensioni dei clienti
5 | 100 % | |
4 | 0 % | |
3 | 0 % | |
2 | 0 % | |
1 | 0 % |


