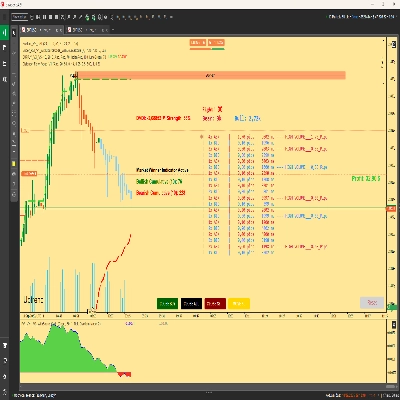
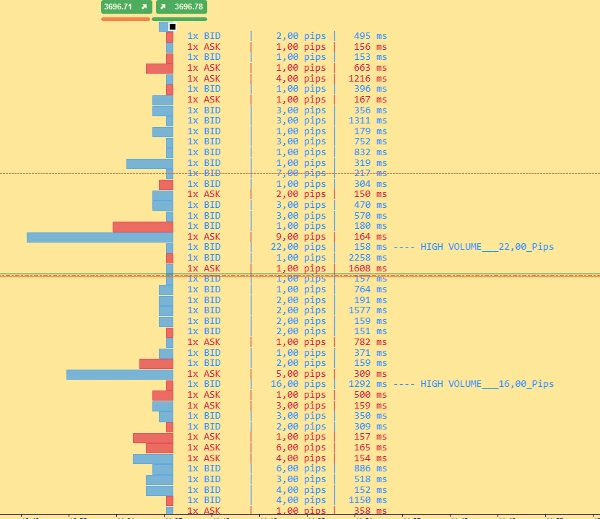
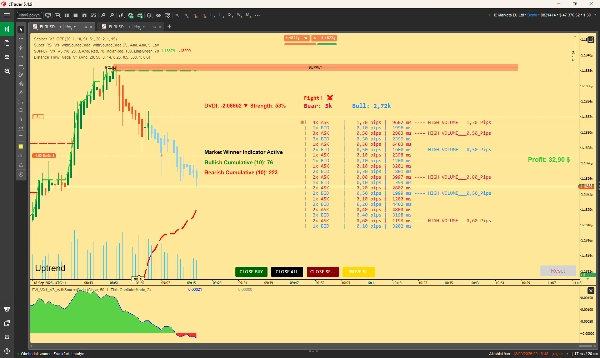
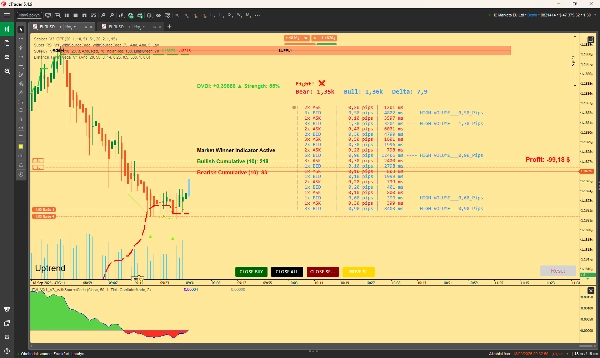
Indikator
NAS100
NZDUSD
Breakout
XAUUSD
Commodities
Forex
Signal
EURUSD
GBPUSD
BTCUSD
Indices
Prop
Stocks
Crypto
USDJPY
Scalping
ORDERFLOW_SKIA_Plynuly
Logo "ORDERFLOW_SKIA_Plynuly"
18/09/2025
171
Desktop
Gambar unggahan "ORDERFLOW_SKIA_Plynuly"Gambar unggahan "ORDERFLOW_SKIA_Plynuly"Gambar unggahan "ORDERFLOW_SKIA_Plynuly"

This Indicator will show you Direction, Distance, and Time; Use this indicator exactly at support and resistance zones to see who the winner is. You will see many high volume texts , while there is bid high volume and bear high volume, do not enter, wait until it calms down and watch where the price is going , the winner is a Bear or Bull? You will see :-) . This indicator will not give you pure buy sell signals, it will give you much more, give to it a time , watch what is happening on chart and watch my indicator and you will soon realize they way to earn some cash is not that hard. Have a nice day. If this Indicator proves useful , i have also much better and polished version with much more signals, and informations. Latest version + Source = $5000 Usd

0.0
Ulasan: 0
Ulasan pelanggan
Belum ada ulasan untuk produk ini. Sudah mencobanya? Jadilah pemberi ulasan pertama!
Produk lain dari penulis ini
Cumulative Delta Candles + VolumeProfile
Cumulative delta candles + volume profile
Support Resistance Zones
Support and Resistance.
DynamicVolumeSupplyDemand
Supply and Demand Zones
VolumeProfile_8
Scalpers Volume Profile
Insider_CumulativeDelta
Robust Cumulative delta,Atr and imbalance indicator.
Tape reader
TAPE READER :-)
Indikator
Grid
NAS100
NZDUSD
+17
Institutional Volume Supply Demand
Volume Profile Supply Demand
Indikator
Breakout
BreakOut_Probability_Expo
Break Out Probability Experimental indicator. Credits for this indicator goes to Zeiierman !!!
MTF Candles
Multi Timeframe Candle drawing. Draw Any candles from any timeframe on your chart :-)
Cumulative Delta_noSourceCode
Demo of my main indcator.
Anda mungkin juga suka
Indikator
RSI
Breakout
XAUUSD
+6
Fair Value Gap Sessions
identify and highlight temporary market inefficiencies known as "fair value gaps" 🚨 within specific trading Sessions.
Indikator
VWAP
ZigZag
Weis & Wyckoff System v2.0
Reko Wic
Visualize global Forex trading sessions with clear time blocks for better timing and strategy planning.
Indikator
NAS100
NZDUSD
XAUUSD
+12
Dynamic Swing Anchored VWAP
Indikator
Breakout
ATR
Signal
+3
Support Resistance Indicator
A custom support resistance indicator, specifically designed for scalping techniques.
Indikator
NAS100
NZDUSD
Breakout
+12
Samurai Breakout Pro II
⚔️Full breakout trading workstation: session box, EP/TP/SL levels, on-chart ✓/✗ outcomes, pro-level analytics and more⚔️
Indikator
Indices
Prop
Breakout
+8
MarketRegimeAI
A cutting‑edge trading indicator that fuses AI and mathematics with adaptive logic to classify market regimes.
Indikator
RSI
Breakout
XAUUSD
+7
Candle Strength Oscillator
The Candle Pressure Index is a powerful, user-friendly indicator that reveals hidden market pressure inside candles.
Smart Floating Risk Pro
📊 Smart Floating Risk Pro – Advanced Risk Management for cTrader
Indikator
RSI
Breakout
Lozano Price Action
LPA simplifies trading by coloring candles with volume data and RSI levels for trend and reversal insights.
Indikator
Breakout
Scalping
SSL Channel
SSL Channel — Trusted by price action traders to stay on the right side of the trend.
Indikator
Grid
XAUUSD
Forex
+3
Daily Open Color Zones
indicator showing the Daily Open Line and instantly shading bullish and bearish zones.
Ichimoku Kinko Hyo
Ichimoku Kinkō Hyō with fixed shift to 25 as Ctrader calculate it from 0 and values was wrong for Chikou Span and Kumo.
Indikator
Indices
Forex
EURUSD
+1
DXY w HMA
DXY HMA Indicator
Indikator
VWAP
Breakout
Scalping
VWAP & Sessions & D,W,M HLO Levels
Killzone Session With VWAP – Precision Meets Price Action
Indikator
Grid
NAS100
NZDUSD
+16
3D Normal Candles bY Mohammad KHR
3D candles for Normal OHLC candles.
Indikator
Breakout
3 Bar Triangle by Linda Raschke
3 bar triangle = high below 2 day high, low above 2 day low