![Trading product for [Stellar Strategies] BOS Trend 1.0 Indikator, image 1](https://cdn.ctrader.com/image/webp/6cdec0f1-0e97-4a82-a8a4-2b67aed54d38_25695)
[Stellar Strategies] BOS Trend 1.0
Indikator
455 unduhan
Versi 1.0, Nov 2024
Windows, Mac
5.0
Ulasan: 1
![Trading product for [Stellar Strategies] BOS Trend 1.0 Indikator, image 2](https://cdn.ctrader.com/image/webp/2738d263-76dc-4e6f-a818-7e66349e6883_25696)
![Trading product for [Stellar Strategies] BOS Trend 1.0 Indikator, image 3](https://cdn.ctrader.com/image/webp/5338cc95-bf3e-4db4-b575-3e935cff8e90_25697)
![Trading product for [Stellar Strategies] BOS Trend 1.0 Indikator, image 4](https://cdn.ctrader.com/image/webp/59502053-3cfb-4232-b1da-c27ad8852e60_25698)
![Trading product for [Stellar Strategies] BOS Trend 1.0 Indikator, image 5](https://cdn.ctrader.com/image/webp/e32ea74f-662d-4c30-8571-3b8062b6be90_25699)
![Trading product for [Stellar Strategies] BOS Trend 1.0 Indikator, image 6](https://cdn.ctrader.com/image/webp/fe0c3dd9-19fe-4833-bd0e-640ccec47e31_25700)
![Trading product for [Stellar Strategies] BOS Trend 1.0 Indikator, image 7](https://cdn.ctrader.com/image/webp/0fa38032-d41c-4684-a0ec-c9512db0d567_25701)
![Trading product for [Stellar Strategies] BOS Trend 1.0 Indikator, image 8](https://cdn.ctrader.com/image/webp/10e865d7-9813-4932-ac9b-3b76516518c9_25702)
Deskripsi
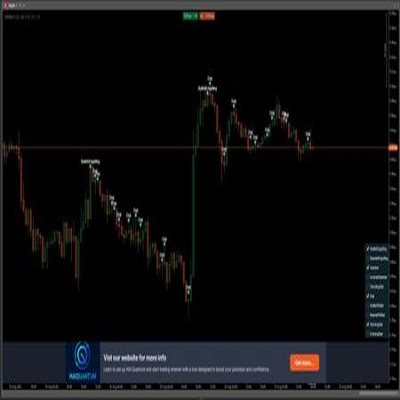
The [Stellar Strategies] BOS Trend adalah indikator Break of Structure (BOS) multi-timeframe premium yang dirancang untuk cAlgo. Ini memberikan wawasan penting kepada trader tentang tren pasar dengan mendeteksi BOS tren naik dan tren turun di berbagai timeframe.
Fitur:
- Analisis Multi-Timeframe: Menganalisis pergerakan harga di berbagai timeframe (1 menit hingga harian).
- Timeframe yang Dapat Disesuaikan: Aktifkan atau nonaktifkan timeframe tertentu untuk menyesuaikan analisis Anda.
- Peringatan Waktu Nyata: Menampilkan pesan di grafik saat BOS terdeteksi.
- Antarmuka Ramah Pengguna: Warna teks yang dapat disesuaikan untuk visibilitas lebih baik pada latar belakang grafik yang berbeda.
Parameter:
- Periode Lookback (Default: 20): Jumlah bar yang dilihat ke belakang saat mendeteksi BOS.
- Parameter Time Frame:
-
Gunakan Time Frame 1 MenitGunakan Time Frame 5 MenitGunakan Time Frame 15 MenitGunakan Time Frame 30 MenitGunakan Time Frame 1 JamGunakan Time Frame 4 JamGunakan Time Frame Harian
- Warna Teks (Default: "Kuning"): Mengatur warna untuk pesan BOS.
Cara Menggunakan Indikator:
- Menambahkan Indikator:
-
- Buka platform cAlgo Anda.
- Navigasi ke bagian indikator dan tambahkan [Stellar Strategies] BOS Trend ke grafik Anda.
- Mengatur Parameter:
-
- Periode Lookback: Sesuaikan periode lookback sesuai strategi trading Anda (default adalah 20 bar).
- Aktifkan/Nonaktifkan Time Frame: Pilih timeframe yang ingin Anda analisis dengan mencentang atau menghapus centang opsi yang sesuai.
- Warna Teks: Pilih warna teks yang kontras dengan latar belakang grafik Anda untuk visibilitas yang jelas.
- Membaca Sinyal BOS:
-
- BOS Tren Naik: Garis hijau menunjukkan break of structure tren naik.
- BOS Tren Turun: Garis merah menunjukkan break of structure tren turun.
- Pesan BOS: Pesan seperti "Current TF: Uptrend BOS detected" akan muncul di grafik, bersama dengan pesan lain dari timeframe berbeda yang telah Anda aktifkan.
- Menginterpretasikan Data:
-
- Gunakan sinyal BOS untuk mengidentifikasi potensi pembalikan atau kelanjutan tren.
- Perhatikan analisis multi-timeframe untuk konfirmasi tren yang lebih kuat.
- Menyesuaikan Tampilan:
-
- Anda dapat menyesuaikan warna teks dan posisi pesan BOS untuk keterbacaan yang lebih baik.
Contoh:
Berikut adalah contoh langkah demi langkah cara menggunakan [Stellar Strategies] BOS Trend indikator:
- Tambahkan Indikator:
-
- Buka grafik di platform cAlgo Anda.
- Pergi ke
Indicatorsdan pilih [Stellar Strategies] BOS Trend.
- Atur Parameter:
-
- Atur
Lookback Periodke 20. - Aktifkan
Use 1 Minute Time Frame,Use 5 Minute Time Frame, dan timeframe lain sesuai kebutuhan. - Atur
Text Colorke "Kuning" untuk visibilitas yang lebih baik.
- Atur
- Pantau Grafik:
-
- Amati garis BOS hijau (tren naik) dan merah (tren turun) pada grafik Anda.
- Cari pesan yang menunjukkan deteksi BOS di berbagai timeframe.
- Ambil Tindakan:
-
- Gunakan sinyal BOS untuk membuat keputusan trading yang tepat berdasarkan pembalikan atau kelanjutan tren.
Dengan mengikuti langkah-langkah ini, Anda dapat menggunakan indikator [Stellar Strategies] BOS Trend secara efektif untuk meningkatkan strategi trading Anda dengan analisis BOS multi-timeframe.
Jangan ragu untuk memberi tahu saya jika Anda membutuhkan bantuan lebih lanjut atau informasi tambahan! 📈📉
Ringkasan
Ringkasan AI
The [Stellar Strategies] BOS Trend is a multi-timeframe Break of Structure (BOS) indicator designed for the cAlgo platform. It identifies key market trend shifts by detecting uptrend and downtrend BOS signals across multiple timeframes ranging from 1 minute to daily charts. Users can customize which timeframes to analyze and adjust the lookback period for BOS detection, with a default of 20 bars. The indicator provides real-time alerts directly on the chart, displaying messages such as "Current TF: Uptrend BOS detected" to inform traders of structural breaks. Visual cues include green lines for uptrend BOS and red lines for downtrend BOS. The interface allows customization of text color to enhance visibility against different chart backgrounds. Traders can use the BOS signals to identify potential trend reversals or continuations, leveraging multi-timeframe analysis for stronger confirmation. The indicator supports flexible configuration to fit various trading strategies and preferences.
Profil indikator
Ulasan pelanggan
5.0
Ulasan: 1
5 | 100 % | |
4 | 0 % | |
3 | 0 % | |
2 | 0 % | |
1 | 0 % |
Ulasan pelanggan
August 18, 2025
Pros: Automatically detects and marks Break Of Structure points indicating trend shifts. Clean visual arrows and straightforward setup. Cons: No alerts, tooltips, or template saving. May produce noise without volume or market context filters.
Diskusi
Pertanyaan umum
Produk-produk yang tersedia melalui cTrader Store, termasuk bot trading, indikator, dan plugin, disediakan oleh pengembang pihak ketiga serta hanya ditujukan untuk akses teknis dan informasi. cTrader Store bukan broker dan tidak menyediakan saran investasi, rekomendasi pribadi, atau jaminan apa pun tentang kinerja di masa mendatang.
Produk lain dari penulis ini
![Logo "[Stellar Strategies] Market Structure Breakout"](https://cdn.ctrader.com/image/webp/bceec265-3247-4b11-915f-6295a29c106d_28465)
![Logo "[Stellar Strategies] Market Session Ultimate"](https://cdn.ctrader.com/image/webp/61ffd537-0125-4246-9e72-42eca1791d64_28232)
![Logo "[Stellar Strategies] Wave Trend Pro"](https://cdn.ctrader.com/image/webp/5f226fbb-245a-41cd-9cdd-b018257d5e6d_28617)
![Logo "[Stellar Strategies] Inside Bar with Signals"](https://cdn.ctrader.com/image/webp/1d9e8bfa-3b2c-4440-bb37-5856902008a7_30683)
![Logo "[Stellar Strategies] Linear Regression Candles 1.1"](https://cdn.ctrader.com/image/webp/8b9cff9f-2431-46d2-b0ec-c7f55f4a4a6d_27918)
![Logo "[Stellar Strategies] Smart ADX"](https://cdn.ctrader.com/image/webp/af13b084-b6f6-41db-b7bc-c7e688b57b05_36929)
![Logo "[StellarStrategies] Scheduled Trade Executor"](https://cdn.ctrader.com/image/webp/daefc6af-7eca-453e-878d-1b981be2c401_25646)
![Logo "[Stellar Strategies] VBO"](https://cdn.ctrader.com/image/webp/f034c012-94d4-445a-a01b-febd1cdedaef_36944)
![Logo "[Stellar Strategies] SP500 Gap Closure cBot 1.0"](https://cdn.ctrader.com/image/webp/92c23fdc-4ad1-4e61-bdb5-c77f6ec8c539_27686)
![Logo "[Stellar Strategies] Candlestick Patterns Dashboard"](https://cdn.ctrader.com/image/webp/ae8691a5-4884-4553-9bcc-64e16ac82a30_38344)
![Logo "[Stellar Strategies] QQE"](https://cdn.ctrader.com/image/webp/e702104a-874c-4b39-97dd-fb34518d1015_27712)
![Logo "[Stellar Strategies] Visual Trend Momentum"](https://cdn.ctrader.com/image/webp/48aee0a5-f10e-4bc8-9671-78e156fcc5df_27548)


![Logo "Gaussian Channel [Iridio Capital]"](https://cdn.ctrader.com/image/webp/7c039209-5573-4a54-a072-f9528b503103_41960)


Harga
20.46M
Volume trading
8K
Pip dimenangkan
25
Penjualan
4.34K
Instal gratis