Descrizione
Descrizione del prodotto: BullMoon Performance Panel
Il BullMoon Performance Panel è uno strumento analitico potente per cTrader, progettato per aiutare i trader a monitorare le proprie prestazioni in tempo reale e a ricostruire visivamente le operazioni passate direttamente sul grafico.
1. Dati di mercato e condizioni
Il pannello analizza i tuoi dati di trading relativi al conto e i dati storici dei prezzi del simbolo selezionato.
- Valuta sia le operazioni chiuse che quelle in corso per calcolare metriche chiave come il profitto netto, il drawdown e il tasso di vincita.
- L'indicatore esamina la tua cronologia per individuare con precisione i punti di entrata e uscita.
2. Interpretazione dei segnali e degli elementi visivi
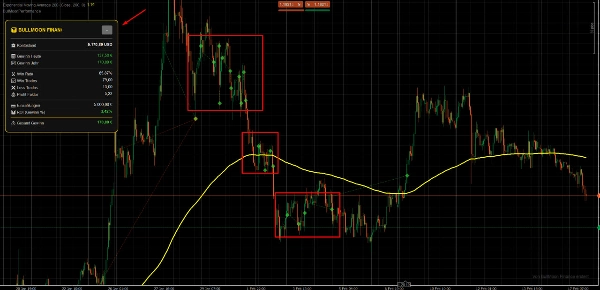
Per rendere l'analisi il più intuitiva possibile, lo strumento utilizza marcatori visivi chiari direttamente sul grafico:
- Simboli: Entrate e uscite sono contrassegnate con simboli specifici (ad esempio, frecce o punti), permettendoti di vedere immediatamente dove una posizione è stata aperta e chiusa.
- Linee visive: Le linee che collegano questi simboli illustrano la durata dell'operazione, rendendo tangibili visivamente le fasi di profitto o perdita.
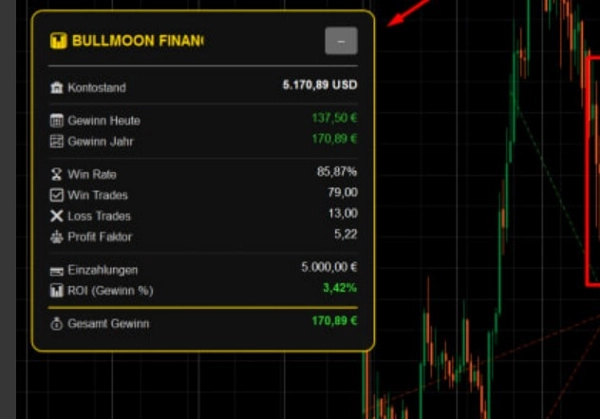
- Dashboard: Un dashboard compatto sullo schermo fornisce dati concreti, inclusi profitto in USD, lotti totali scambiati e il fattore R.
3. Impostazioni e parametri chiave
Puoi personalizzare il pannello per adattarlo al tuo stile di trading specifico:
- Periodo storico: Definisci quanti giorni di operazioni passate devono essere visualizzati sul grafico.
- Aspetto visivo: I colori per le operazioni vincenti e perdenti, così come la trasparenza di linee e simboli, sono completamente regolabili.
- Base di calcolo: Imposta dimensioni fisse dei lotti o un rischio basato su percentuale per l'output statistico.
4. Casi d'uso tipici e scenari di trading
- Analisi post-trade: Rivedi la tua giornata di trading per assicurarti di aver seguito correttamente la tua strategia.
- Ottimizzazione della strategia: Identifica visivamente se i tuoi livelli di Take Profit o Stop Loss sono impostati costantemente troppo stretti o troppo ampi.
- Monitoraggio in tempo reale: Tieni traccia delle tue prestazioni giornaliere attuali senza dover passare continuamente alla scheda della cronologia del conto.
5. Pubblico target (dimensione del conto ed esperienza)
- Livello di esperienza: Adatto a principianti che desiderano acquisire una migliore percezione delle proprie operazioni, così come a professionisti che necessitano di un rapido controllo visivo delle prestazioni.
- Dimensione del conto: Adatto a qualsiasi dimensione di conto. È particolarmente prezioso per i trader che gestiscono più strategie contemporaneamente e che devono mantenere una panoramica chiara.
6. Limitazioni importanti e note sull'uso
- Piattaforma: Sviluppato esclusivamente per cTrader.
- Disponibilità dei dati: La visualizzazione delle operazioni storiche dipende dalla disponibilità dei dati nella cronologia del tuo conto cTrader.
- Non è un generatore di segnali: Si prega di notare che questo pannello è uno strumento analitico e non genera segnali di acquisto o vendita indipendenti.
Riepilogo
Recensioni dei clienti
5 | 100 % | |
4 | 0 % | |
3 | 0 % | |
2 | 0 % | |
1 | 0 % |