Описание
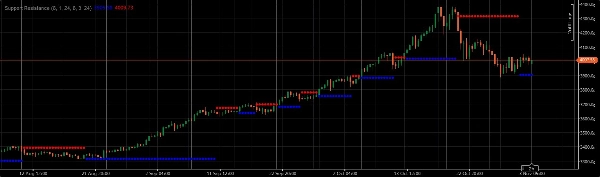
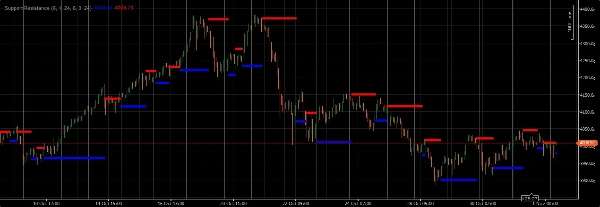
При торговле золотом используйте уровни поддержки и сопротивления на различных таймфреймах (крупные, диапазонные и тиковые графики), чтобы выявлять потенциальные прорывы пивотов или точки поддержки/сопротивления. Всегда подтверждайте эти сигналы другими техническими индикаторами, такими как скользящие средние, осцилляторы и свечные модели, для сделок с более высокой вероятностью успеха
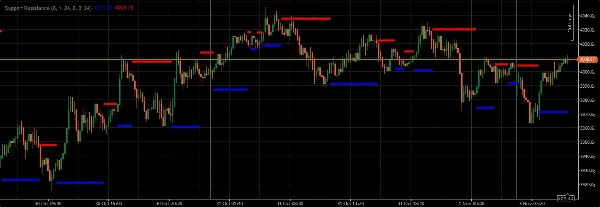
При торговле золотом используйте уровни поддержки и сопротивления на различных таймфреймах (крупные, диапазонные и тиковые графики), чтобы выявлять потенциальные прорывы пивотов или точки поддержки/сопротивления. При торговле золотом используйте уровни поддержки и сопротивления на различных таймфреймах (крупные, диапазонные и тиковые графики), чтобы выявлять потенциальные прорывы пивотов или точки поддержки/сопротивления. Эти уровни, как только они определены, могут служить важными точками принятия решений. Прорыв выше сопротивления или ниже поддержки, особенно сопровождаемый увеличением тела свечи, часто сигнализирует о продолжении тренда или значительном изменении рыночного настроения. Напротив, отскок от уровня поддержки или отторжение на сопротивлении может указывать на потенциальный разворот или продолжение текущей консолидации. Всегда подтверждайте эти сигналы другими техническими индикаторами, такими как скользящие средние, осцилляторы и свечные модели, для сделок с более высокой вероятностью успеха. Кроме того, уделяйте пристальное внимание новостным событиям и публикациям экономических данных, так как они могут существенно влиять на цены золота и аннулировать чисто технические установки. Управление рисками имеет первостепенное значение; никогда не рискуйте более чем небольшой частью вашего торгового капитала в одной сделке.
Сводка
Отзывы покупателей
5 | 100 % | |
4 | 0 % | |
3 | 0 % | |
2 | 0 % | |
1 | 0 % |


