Description
Concepts Smart Money — aperçu général
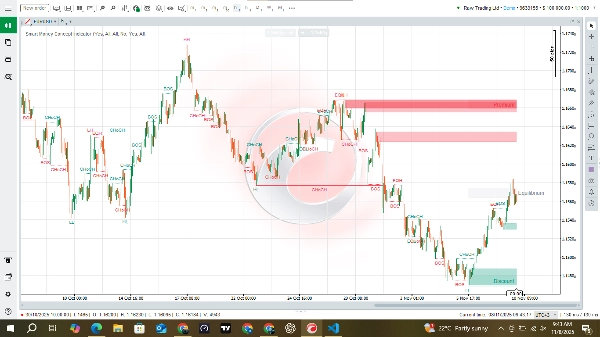
Les Concepts Smart Money visualisent où l’activité professionnelle / institutionnelle a probablement influencé le prix. Ils identifient automatiquement la structure du marché (structure swing et structure à court terme), mettent en évidence les ruptures de structure (BOS) et les changements de caractère (CHoCH), trouvent les plus hauts/bas égaux, capturent les plages candidates de blocs d’ordres (zones où les gros acteurs ont pu passer des ordres), et dessinent des zones contextuelles (prime, équilibre, remise). Ils s’adaptent à la volatilité du marché de sorte que leurs seuils évoluent avec l’activité actuelle de l’instrument.
Ce que les traders obtiennent en un coup d’œil
- Étiquettes claires montrant quand la structure bascule ou est rompue (vous aidant à déterminer le biais).
- Zones de blocs d’ordres mises en évidence — poches potentielles d’offre/demande où le prix est souvent retesté.
- Marqueurs de plus hauts/bas égaux — probablement des nœuds de liquidité pour les chasses aux stops ou les retests.
- Zones contextuelles — prime (cher), équilibre (valeur équitable), remise (pas cher) — utiles pour le biais et les objectifs.
- Suivi des plus hauts & bas forts/faibles montrant les extrêmes significatifs récents.
Pourquoi cela est utile pour les traders SMC
- Accélère l’identification des niveaux : trace et stocke les niveaux pour que vous ne cherchiez pas manuellement les pivots et blocs d’ordres.
- Cohérence : applique les mêmes règles pour repérer les basculements de structure et les candidats blocs d’ordres à travers les instruments et les périodes.
- Entrées contextuelles : montre où l’intérêt institutionnel peut se situer — les traders peuvent planifier des entrées sur les retests de ces zones plutôt que de deviner.
- Cadre de gestion des risques : les zones et les bords des blocs d’ordres fournissent des endroits logiques pour les stops et objectifs (par exemple, stop au-delà d’un bas/haut de bloc d’ordre).
- Flux de travail multi-échelle : utilisez la structure à plus grande échelle pour le biais et la structure interne plus petite pour des entrées précises.
Comment interpréter les éléments principaux
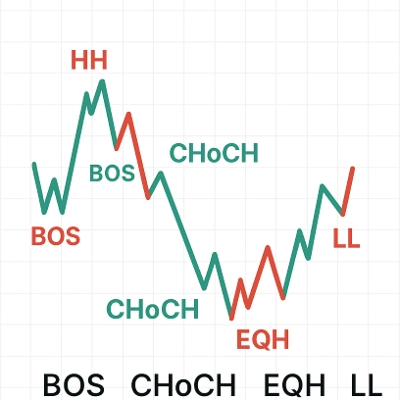
- BOS (Break of Structure) — signal de continuation dans la direction de la rupture ; utile pour confirmer la tendance.
- CHoCH (Change of Character) — indication que le comportement du marché peut basculer ; à traiter comme un renversement potentiel ou un changement de biais.
- Blocs d’ordres (OBs) — plages de prix où de gros ordres se sont probablement accumulés ; attendez-vous à des retests et rejets à ces endroits.
- Plus hauts/bas égaux — niveaux répétés où la liquidité s’accumule ; souvent ciblés avant de grands mouvements.
- Prime/Équilibre/Remise — une carte de valeur simple : la prime favorise les vendeurs, la remise favorise les acheteurs, l’équilibre est neutre/moyen.


