Deskripsi
Smart Floating Risk Ultimate - Dasbor Perdagangan Profesional Anda
Ubah Manajemen Risiko Anda dengan Intelijen Waktu Nyata
Smart Floating Risk Ultimate bukan hanya indikator—ini adalah analis risiko pribadi Anda yang bekerja 24/7 di grafik perdagangan Anda. Dirancang untuk trader serius yang menginginkan presisi dan kejelasan dalam manajemen risiko mereka.
✨ Apa yang Membuatnya Ultimate?
📈 Gambaran Keuangan Lengkap Sekilas:
- Lihat Saldo, Ekuitas, dan Floating P&L secara instan
- Tidak perlu lagi berganti tab atau menghitung secara manual
- Pengkodean warna dinamis: Hijau saat menang, Merah saat kalah—umpan balik visual instan
🎯 Analisis Risiko Multi-Simbol Lanjutan:
- Perdagangan Emas, EUR/USD, dan Minyak secara bersamaan? Tidak masalah!
- Dapatkan rincian risiko individual untuk setiap simbol
- Ketahui dengan tepat berapa banyak risiko dan potensi keuntungan per aset
💰 Perhitungan Risiko Cerdas:
- Total Risiko Kerugian: Apa yang akan Anda rugikan jika semua Stop Loss terkena ($ + %)
- Total Potensi Keuntungan: Apa yang akan Anda dapatkan jika semua Take Profit tercapai ($ + %)
- Analisis Per-Simbol: Rincian mendalam untuk setiap instrumen perdagangan
- Semua perhitungan ditampilkan dalam USD dan persentase saldo Anda
🎨 Intelijen Break-Even:
- Garis break-even otomatis digambar di grafik Anda
- Langsung lihat apakah Anda di atas atau di bawah break-even
- Sempurna untuk strategi DCA (Dollar Cost Averaging)
- Memperbarui secara real-time saat Anda menambah atau menutup posisi
⚡ Performa Waktu Nyata:
- Pembaruan instan saat Anda membuka, menutup, atau memodifikasi posisi
- Tanpa lag, tanpa penundaan—selalu akurat
- Teknologi berbasis event memastikan tidak ada dampak performa
🎨 Sepenuhnya Dapat Disesuaikan:
- Pilih posisi sudut yang Anda sukai (Atas/Bawah, Kiri/Kanan)
- Atur warna keuntungan/kerugian
- Sesuaikan ukuran font untuk visibilitas optimal
- Sesuaikan gaya garis break-even agar sesuai dengan tema grafik Anda
👨💼 Sempurna Untuk:
✅ Day Traders - Memantau banyak posisi di berbagai simbol
✅ Scalpers - Penilaian risiko cepat untuk pengambilan keputusan cepat
✅ Swing Traders - Melacak eksposur jangka panjang dan level break-even
✅ Strategi DCA - Sempurna untuk strategi averaging down/up
✅ Manajer Risiko - Pemantauan risiko tingkat profesional
✅ Trader Multi-Akun - Gambaran jelas untuk setiap akun perdagangan
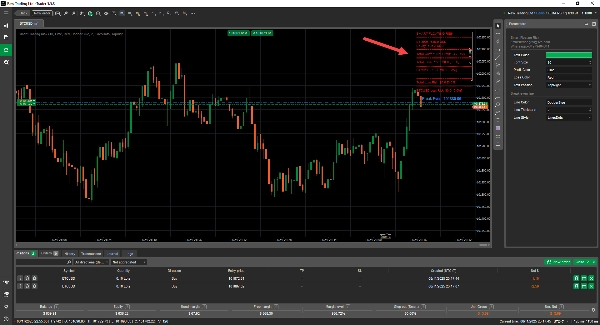
📊 Contoh Tampilan:
SMART FLOATING RISK
==============================
Saldo: 10,000.0 USD
Ekuitas: 10,250.5 USD
==============================
Total Laba Bersih Saat Ini: 250.5 USD [2.5%]
==============================
Total Take Profit: $500.0 [5.0%]
------------------------------------------------------------
Keuntungan XAUUSD: $300.0 [3.0%]
Keuntungan EURUSD: $200.0 [2.0%]
==============================
Total Risiko Kerugian: $150.0 [1.5%]
------------------------------------------------------------
Risiko Kerugian XAUUSD: $100.0 [1.0%]
Risiko Kerugian EURUSD: $50.0 [0.5%]
💎 Investasi untuk Kesuksesan Perdagangan Anda:
Ini bukan hanya indikator—ini adalah sistem manajemen risiko profesional yang membayar dirinya sendiri dengan membantu Anda:
- Menghindari over-leveraging
- Membuat keputusan ukuran posisi yang tepat
- Memahami eksposur sebenarnya di berbagai simbol
- Berdagang dengan percaya diri mengetahui risiko/imbalan Anda secara tepat
🎁 Apa yang Anda Dapatkan:
✅ Lisensi seumur hidup untuk cTrader
✅ Berfungsi pada semua simbol dan kerangka waktu
✅ Tanpa biaya berlangganan
✅ Pembaruan dan peningkatan rutin
✅ Dukungan profesional melalui Email & WhatsApp
⚠️ Kendalikan Risiko Anda. Berdagang dengan Percaya Diri. Berdagang dengan Intelijen.
Smart Floating Risk Ultimate - Karena Trader Profesional Layak Mendapatkan Alat Profesional.
🎯 Ajakan Bertindak:
Jangan berdagang secara buta. Ketahui risiko Anda. Ketahui potensi Anda. Dapatkan Smart Floating Risk Ultimate hari ini dan ubah manajemen risiko Anda dari tebak-tebakan menjadi presisi.
Ringkasan
Ulasan pelanggan
5 | 100 % | |
4 | 0 % | |
3 | 0 % | |
2 | 0 % | |
1 | 0 % |