Deskripsi
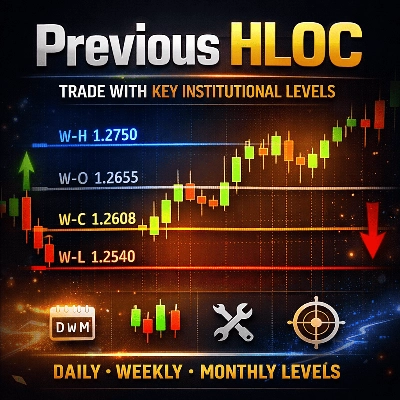
Previous HLOC – Level Waktu Lebih Tinggi Pintar untuk Perdagangan Presisi
Previous HLOC adalah indikator multi-timeframe profesional yang memplot level High, Low, Open, dan Close periode sebelumnya langsung pada grafik Anda dengan kejelasan dan kustomisasi yang tak tertandingi.
Dirancang untuk trader aksi harga, scalper, trader intraday, dan trader swing, indikator ini membantu Anda mengidentifikasi secara instan level institusional kunci yang sering berfungsi sebagai zona support, resistance, penolakan, dan target likuiditas.
Mengapa Previous HLOC?
Pasar secara konsisten bereaksi terhadap level hari, minggu, dan bulan sebelumnya. Institusi, algoritma, dan trader profesional memantau level ini dengan cermat.
Previous HLOC membawa harga-harga penting tersebut ke grafik Anda dengan cara yang bersih dan bebas gangguan—sehingga Anda tidak pernah melewatkannya.
Fitur Utama
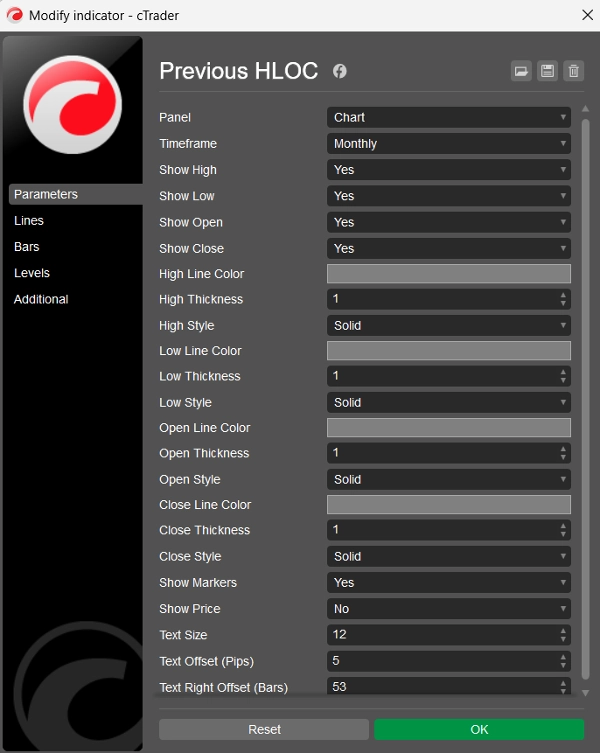
✅ Level Multi-Timeframe
- Pilih level candle Harian, Mingguan, Bulanan, atau Per Jam
- Level tetap akurat tanpa memandang timeframe grafik Anda
✅ Kontrol HLOC Penuh
- Aktifkan atau nonaktifkan High, Low, Open, Close secara individual
- Perdagangkan hanya apa yang penting untuk strategi Anda
✅ Kustomisasi Lanjutan
- Pisahkan warna, ketebalan, dan gaya garis untuk setiap level
- Penanda font Consolas yang bersih dengan ukuran teks yang dapat disesuaikan
- Tampilan harga opsional di samping setiap penanda
✅ Penanda Mengambang Pintar
- Penanda bergerak secara alami bersama grafik
- Selalu tetap sejajar dengan level harga saat menggulir
- Diposisikan di sisi kanan untuk visibilitas yang jelas
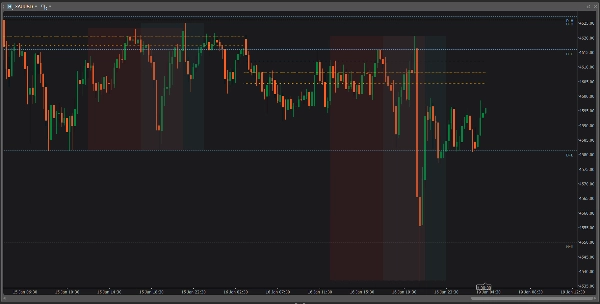
✅ Level Proyeksi Masa Depan
- Garis memanjang jauh ke masa depan
- Ideal untuk merencanakan entri, keluar, stop-loss, dan level take-profit
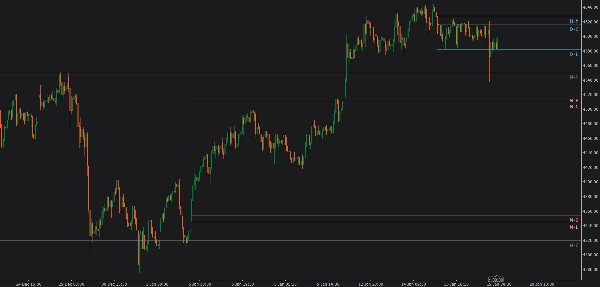
🔹 Cara Trader Menggunakannya
📌 Identifikasi support & resistance intraday yang kuat
📌 Gunakan High/Low sebelumnya sebagai zona sapuan likuiditas
📌 Perdagangkan breakout, penolakan, dan retest
📌 Sesuaikan entri dengan bias timeframe lebih tinggi
📌 Tingkatkan presisi risiko-hadiah
🔹 Untuk Siapa Indikator Ini?
✔ Trader forex
✔ Trader indeks & komoditas
✔ Scalper dan trader harian
✔ Trader swing
✔ Trader aksi harga & SMC
🔹 Bersih. Cepat. Andal.
- Tidak ada repainting
- Tidak ada lag
- Tidak berantakan
- Bekerja pada semua simbol dan semua timeframe
🔹 Ringkasan
Previous HLOC bukan sekadar indikator level biasa—ini adalah alat perdagangan profesional yang membantu Anda berdagang dengan konteks, struktur, dan kepercayaan diri.
Jika Anda berdagang di sekitar level sesi sebelumnya, indikator ini wajib ada di grafik Anda.
Ringkasan
Ulasan pelanggan
5 | 100 % | |
4 | 0 % | |
3 | 0 % | |
2 | 0 % | |
1 | 0 % |

![Logo "[Hamster-Coder] Bollinger Bands"](https://cdn.ctrader.com/image/webp/21d8e5d6-fb11-4bac-b9ee-cd05c2b76804_30327)


