
Descripción
Meravith Auto es una versión automatizada del sistema de trading manual Meravith.
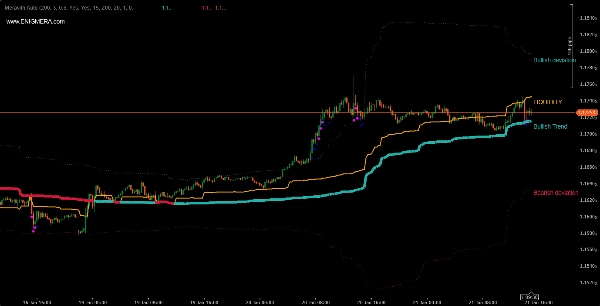
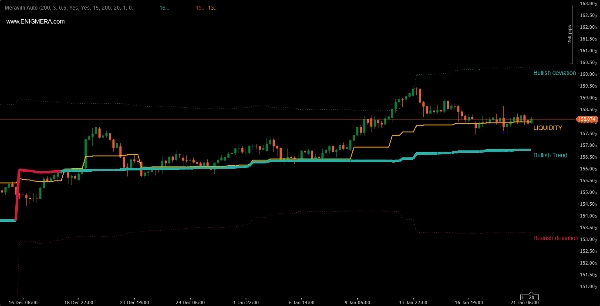
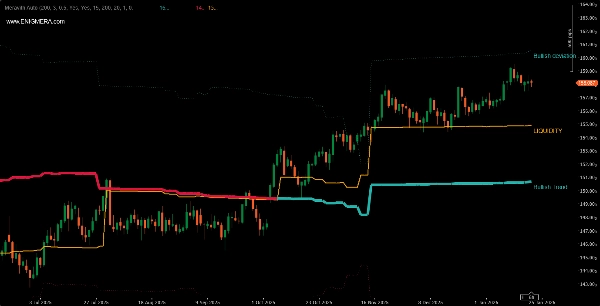
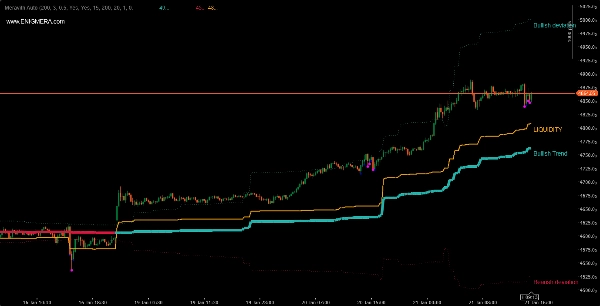
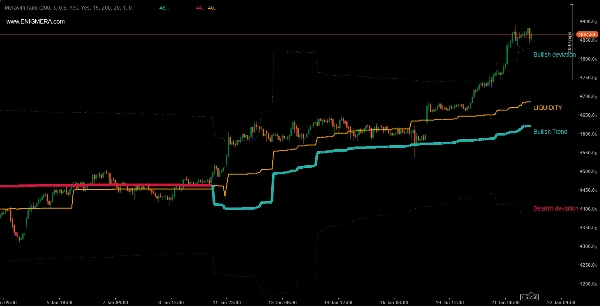
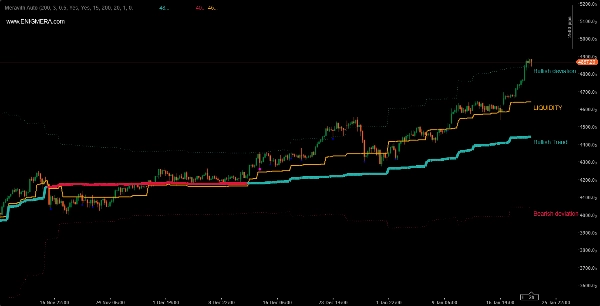
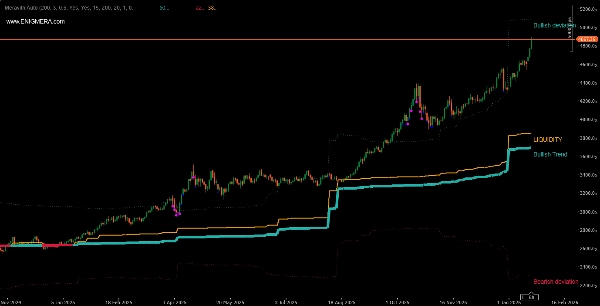
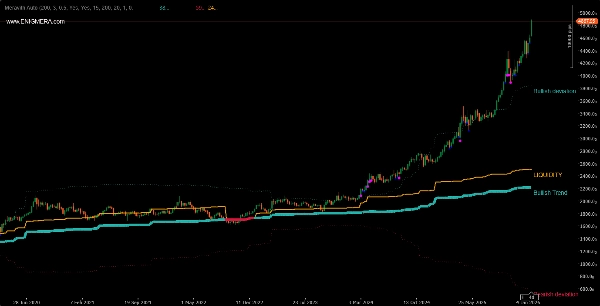
El indicador consta de:
- Línea de tendencia que cambia de color. Cuando es alcista es verde, y cuando es bajista es roja. Esta es la línea de soporte de la tendencia.
- Línea de liquidez, donde el volumen alcista es igual al volumen bajista.
- Línea de desviación alcista triple.
- Línea de desviación bajista triple.
- Puntos morados y azules que indican alto volumen. El punto morado indica un volumen mayor por dos desviaciones del volumen promedio, y el punto azul dos desviaciones.
¿Cómo usarlo?
- Línea de tendencia alcista más liquidez por encima de la línea de tendencia equivale a una tendencia alcista. Esperamos que el mercado se mueva hacia arriba. Abrimos posiciones largas.
- Línea de tendencia bajista más liquidez por debajo de la línea de tendencia equivale a una tendencia bajista. Esperamos que el mercado se mueva hacia abajo. Abrimos posiciones cortas.
Combínelo a su discreción con otros indicadores.
Puede usarse en cualquier par y en cualquier marco temporal.
Puede ver resultados diferentes con distintos brokers debido al volumen que cotizan.
Se prefieren brokers más grandes debido a su mayor volumen.
¿Cuál es la diferencia entre las versiones automatizada y manual?
- En la versión manual, tenemos una evaluación de la tendencia basada en máximos y mínimos. En consecuencia, también proporciona niveles de agotamiento de volumen en el mercado.
- En la versión automatizada, tenemos un período que cambia a lo largo de diferentes fases del mercado. Puede variar, siendo corto durante alta volatilidad y largo durante baja volatilidad. Aquí no hay niveles de agotamiento, ya que no se analiza una tendencia, sino un período. Esta es la razón por la que tenemos desviaciones. Por defecto, se muestra la desviación triple.
Resumen
Perfil del indicador
Valoraciones de clientes
0.0
Valoraciones: 0
Valoraciones de clientes
Este producto todavía no se ha valorado. ¿Ya lo ha probado? Sea el primero en informar a otros.
Conversación
Preguntas frecuentes
BTCUSD
Forex
Signal
Breakout
Indices
EURUSD
Commodities
GBPUSD
NZDUSD
Prop
Scalping
Crypto
Stocks
XAUUSD
NAS100
USDJPY
VWAP
Los productos disponibles a través de cTrader Store, incluidos bots, indicadores y plugins para operar, son proporcionados por desarrolladores de terceros y están disponibles únicamente con fines informativos y de acceso técnico. cTrader Store no es un bróker, por lo que no proporciona asesoramiento de inversión, recomendaciones personales ni ninguna garantía de rentabilidad futura.


Precio
Desde 24/10/2025