
APA YANG DILAKUKANNYA
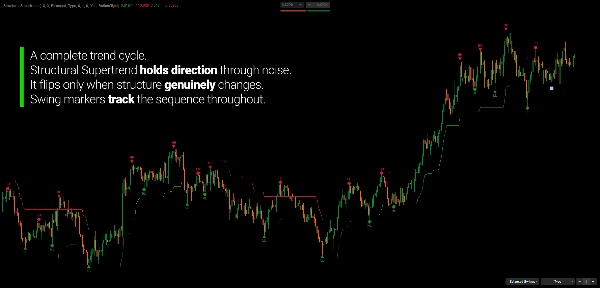
Structural Supertrend mengatasi keterbatasan mendasar dari Supertrend klasik: ia membalik arah saat harga ditutup melewati batasnya.
Dalam tren yang bersih, itu bekerja dengan baik. Dalam kondisi yang volatil atau berombak, satu candle agresif dapat memicu pembalikan — bahkan ketika tren yang lebih luas tetap secara struktural utuh. Hasilnya adalah sinyal palsu, keluar terlalu dini, dan masuk kembali dengan harga yang lebih buruk.
Indikator ini dibangun berdasarkan premis yang berbeda.
Perubahan arah hanya terjadi ketika harga mengonfirmasi pergeseran struktural yang nyata — bukan hanya penutupan sesaat melewati ambang batas. Hasilnya adalah lebih sedikit pembalikan palsu dan keselarasan yang lebih baik dengan bagaimana tren sebenarnya berkembang.
Supertrend menjadi struktural. Sinyal menjadi bermakna.
MENGAPA STRUCTURAL SUPERTREND?
Masalahnya
Supertrend asli memperlakukan setiap penutupan melewati batasnya sebagai pembalikan. Ini disengaja — membuat indikator reaktif secara desain. Namun, reaktivitas memiliki konsekuensi.
Selama fase konsolidasi, harga sering menutup melewati satu batas lalu segera berbalik. Masing-masing menghasilkan sinyal pembalikan, setiap pembalikan mewakili keputusan perdagangan potensial, dan setiap pembalikan mewakili keluar dari posisi yang sebenarnya tidak perlu keluar.
Trader yang telah menggunakan Supertrend cukup lama tahu betul frustrasi ini.
Solusinya
Structural Supertrend memperluas model asli untuk membedakan antara penutupan yang dipicu volatilitas dan perubahan arah yang nyata. Ini menyaring noise dengan memerlukan konfirmasi struktural sebelum mengubah arah tren.
Lebih sedikit pembalikan. Keselarasan tren yang lebih baik. Kurang reaktif terhadap candle individual.
Mengapa Mempertahankan Keduanya?
Supertrend asli masih muncul di grafik — tetapi hanya di tempat yang berbeda dari Structural. Desain ini disengaja.
- Structural melacak arah tren utama
- Asli mengungkapkan perilaku impuls dan korektif dalam tren tersebut
Ketika keduanya setuju: keyakinan arah yang kuat. Ketika mereka berbeda: pergerakan kemungkinan korektif, bukan pembalikan sejati. Pandangan berlapis ganda ini memberikan konteks yang tidak diberikan oleh salah satu garis saja.
DETEKSI AYUNAN TERINTEGRASI
Structural Supertrend mencakup deteksi ayunan penuh dan kerangka kerja S/R — bukan sebagai fitur sekunder, tetapi sebagai perpanjangan langsung dari analisis struktural.
Ayunan diidentifikasi melalui proses kualifikasi struktur-pertama: setiap kandidat dievaluasi berdasarkan perpindahan, konfirmasi volume, dan jarak relatif ATR sebelum diterima. Ini menjaga peta ayunan fokus pada titik balik bermakna daripada setiap ekstrem lokal.
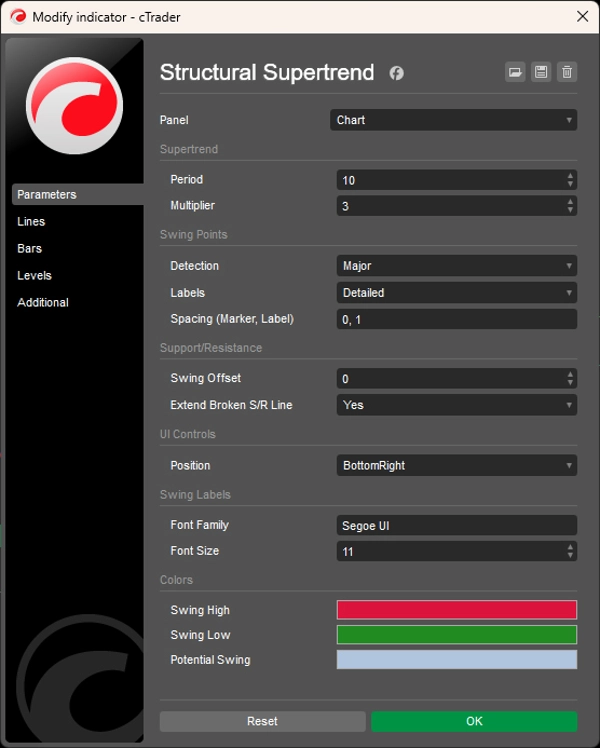
Tiga Mode Deteksi
- Minor — sensitivitas meningkat, menangkap ayunan dalam tren
- Seimbang — granularitas tersaring, terbaik untuk sebagian besar kasus penggunaan
- Mayor — hanya pivot struktural terkuat, dikonfirmasi oleh kriteria yang lebih luas
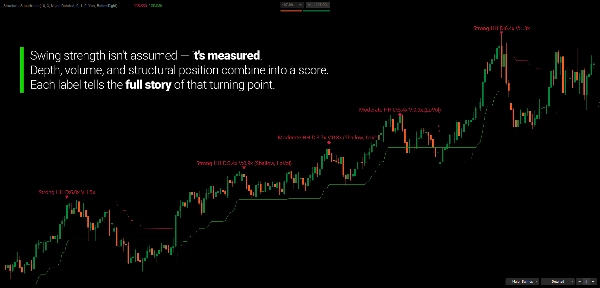
Klasifikasi Kekuatan Ayunan
Setiap ayunan yang dikonfirmasi dinilai berdasarkan kedalaman, volume, dan posisi struktural relatif terhadap ayunan sebelumnya dari jenisnya. Kekuatan diklasifikasikan secara dinamis menggunakan peringkat persentil di seluruh riwayat ayunan terbaru — bukan ambang tetap. Penanda visual mencerminkan klasifikasi: segitiga untuk kuat, berlian untuk sedang, lingkaran untuk lemah.
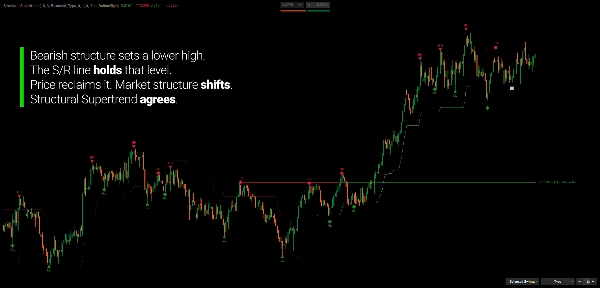
Zona S/R dengan Pelacakan Polaritas
Ayunan yang dikonfirmasi menjadi level S/R aktif yang melacak riwayat interaksi mereka sendiri. Ketika harga mengunjungi kembali level, indikator mencatat apakah kontak adalah penolakan sumbu atau pelanggaran badan. Ketika level disapu dan ditutup melewatinya, polaritas berbalik — resistensi sebelumnya menjadi dukungan, dan sebaliknya. Jika disapu lagi, zona menjadi tidak valid.
Label usia menunjukkan berapa lama setiap level telah aktif dan berapa kali telah diuji.
MEMBACA GRAFIK
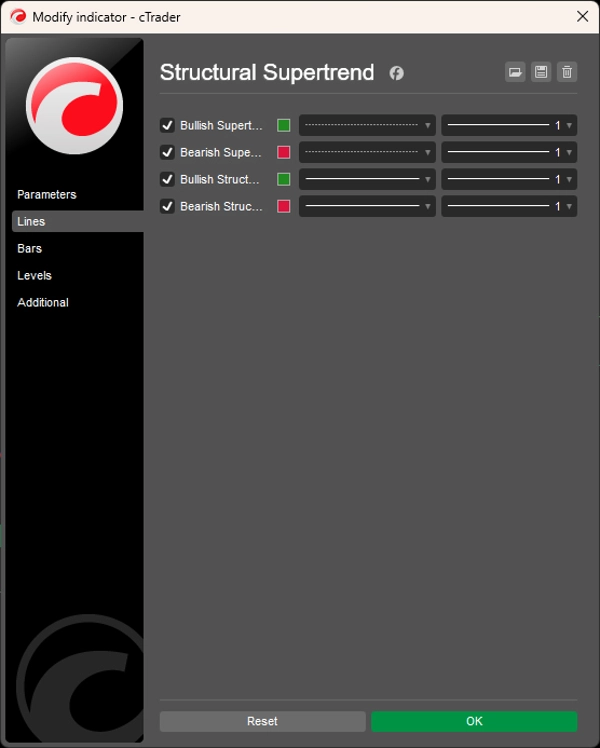
- Garis Struktur Hijau: Tren struktural bullish (dukungan dinamis)
- Garis Struktur Merah: Tren struktural bearish (resistensi dinamis)
- Garis Titik-titik: Supertrend Asli — hanya terlihat di tempat berbeda dari Structural
- Garis S/R: Level aktif dengan status polaritas dan usia
Pemeriksaan Keselarasan Tren:
- Struktur + Asli setuju → Pergerakan arah dengan keyakinan tinggi
- Struktur + Asli berbeda → Kemungkinan fase korektif atau transisi
UNTUK SIAPA INI
Indikator ini untuk trader yang ingin membaca arah tren dan struktur pasar dari satu kerangka kerja yang koheren.
Jika Anda telah menggunakan Supertrend klasik dan merasa terlalu reaktif — sering berbalik selama kondisi sideways — Structural Supertrend dibuat untuk mengatasi hal itu secara tepat.
Ini sangat cocok untuk trader tren dan ayunan yang menginginkan bacaan arah yang lebih bersih tanpa pembalikan palsu yang konstan, trader berbasis struktur yang melacak urutan ayunan untuk memvalidasi kesehatan tren, dan trader diskresioner yang menggunakan level S/R sebagai konteks untuk entri, keluar, dan manajemen posisi.
Kontrol UI bawaan membuatnya praktis untuk penggunaan waktu nyata: ganti mode deteksi, sesuaikan referensi S/R, dan alihkan detail label langsung di grafik — tanpa perlu membuka panel pengaturan.
Ini bukan generator sinyal. Ini adalah kerangka kerja analisis struktural untuk trader yang ingin memahami di mana pasar berada, bukan hanya apa yang sedang terjadi sekarang.
APA YANG MEMBUATNYA BERBEDA
Sebagian besar implementasi Supertrend memperlakukan setiap penutupan melewati batas sebagai tindakan yang dapat diambil. Yang ini memperlakukannya sebagai kandidat — dan memerlukan bukti struktural sebelum berkomitmen pada perubahan arah.
Sebagian besar detektor ayunan mengidentifikasi titik tinggi dan rendah lokal tanpa kriteria evaluasi. Yang ini mengkualifikasi setiap ayunan berdasarkan perpindahan, volume, dan posisi struktural — dan menilai kekuatan secara dinamis terhadap riwayat ayunan terbaru.
Sebagian besar alat S/R menggambar garis dan membiarkannya. Yang ini melacak riwayat interaksi, menandai perubahan polaritas, dan terus berkembang saat pasar mengunjungi kembali setiap level.
Hasilnya: alat tren dan struktur yang tetap relevan lebih lama, kurang reaktif terhadap noise, dan membangun gambaran kondisi pasar yang lebih kaya seiring waktu.
---
MEMAHAMI ANALISIS STRUKTURAL
Struktur pasar bukan tentang menemukan ayunan "yang benar" atau arah tren "yang tepat". Ini tentang mempertahankan gambaran objektif tentang bagaimana urutan harga berkembang — dan apakah urutan itu tetap koheren atau mulai menurun.
Tren didefinisikan bukan oleh satu pergerakan tetapi oleh serangkaian hubungan: titik tertinggi dan terendah yang lebih tinggi dalam tren naik, titik tertinggi dan terendah yang lebih rendah dalam tren turun. Setiap ayunan baru mengonfirmasi atau menantang urutan yang ada. Ketika konfirmasi berlanjut, struktur tetap utuh. Ketika terputus, struktur sedang bertransisi.
Yang membuat analisis struktural berguna bukan karena memprediksi ke mana harga akan pergi, tetapi karena menggambarkan di mana harga saat ini berada dalam urutannya sendiri. Perbedaan ini penting. Prediksi memerlukan asumsi tentang masa depan. Observasi struktural hanya memerlukan pembacaan akurat tentang apa yang sudah terjadi.
Indikator yang dibangun berdasarkan logika struktural dirancang untuk mendukung observasi itu — untuk membuat urutan terlihat dan dapat dilacak tanpa memperkenalkan interpretasi subjektif. Tujuannya adalah kejelasan tentang kondisi pasar saat ini, bukan kepastian tentang arah harga masa depan.
---
Perdagangan melibatkan risiko. Indikator ini adalah alat analisis teknikal — selalu terapkan manajemen risiko yang tepat.
5 | 67 % | |
4 | 33 % | |
3 | 0 % | |
2 | 0 % | |
1 | 0 % |


