Deskripsi
Deskripsi Produk: BullMoon Performance Panel
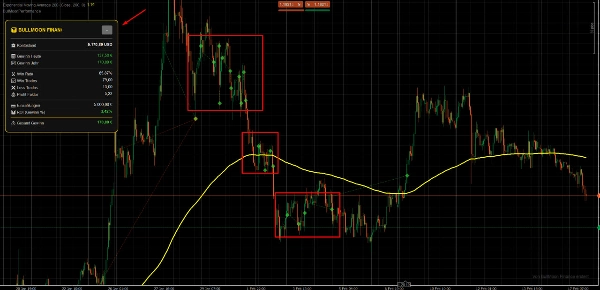
The BullMoon Performance Panel adalah alat analisis yang kuat untuk cTrader, dirancang untuk membantu trader memantau kinerja mereka secara real-time dan merekonstruksi secara visual perdagangan masa lalu langsung di grafik.
1. Data dan Kondisi Pasar
Panel menganalisis data perdagangan terkait akun Anda dan data harga historis dari simbol yang dipilih.
- Ini mengevaluasi perdagangan yang sudah ditutup dan yang sedang berjalan untuk menghitung metrik utama seperti keuntungan bersih, drawdown, dan tingkat kemenangan.
- Indikator memindai riwayat Anda untuk menemukan titik masuk dan keluar dengan tepat.
2. Interpretasi Sinyal dan Elemen Visual
Untuk membuat analisis semudah mungkin, alat ini menggunakan penanda visual yang jelas langsung di grafik:
- Simbol: Entri dan keluar ditandai dengan simbol khusus (misalnya, panah atau titik), memungkinkan Anda melihat langsung di mana posisi dibuka dan ditutup.
- Garis Visual: Garis yang menghubungkan simbol-simbol ini menggambarkan durasi perdagangan, membuat fase keuntungan atau kerugian menjadi nyata secara visual.
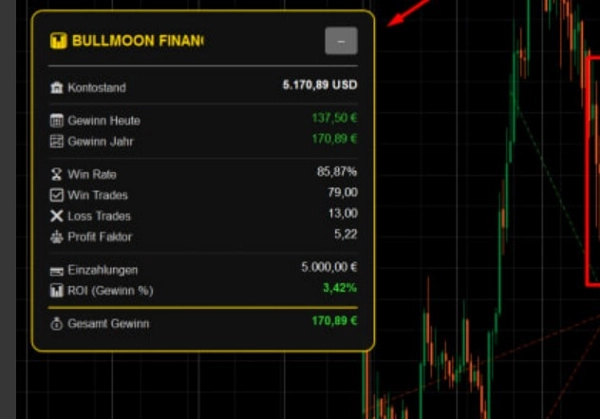
- Dashboard: Dashboard ringkas di layar menyediakan fakta keras, termasuk keuntungan dalam USD, total lot yang diperdagangkan, dan faktor R.
3. Pengaturan dan Parameter Utama
Anda dapat menyesuaikan panel agar sesuai dengan gaya perdagangan spesifik Anda:
- Periode Riwayat: Tentukan berapa hari perdagangan masa lalu yang harus ditampilkan di grafik.
- Visual: Warna untuk perdagangan yang menang dan kalah, serta transparansi garis dan simbol, dapat disesuaikan sepenuhnya.
- Basis Perhitungan: Tetapkan ukuran lot tetap atau risiko berbasis persentase untuk keluaran statistik.
4. Kasus Penggunaan dan Skenario Perdagangan Umum
- Analisis Pasca-Perdagangan: Tinjau hari perdagangan Anda untuk memastikan Anda mengikuti strategi dengan benar.
- Optimasi Strategi: Identifikasi secara visual apakah level Take Profit atau Stop Loss Anda secara konsisten terlalu ketat atau terlalu lebar.
- Pemantauan Langsung: Pantau kinerja harian Anda saat ini tanpa harus bolak-balik ke tab riwayat akun.
5. Audiens Target (Ukuran Akun dan Pengalaman)
- Tingkat Pengalaman: Cocok untuk pemula yang ingin mendapatkan pemahaman lebih baik tentang perdagangan mereka, serta profesional yang memerlukan pemeriksaan kinerja visual cepat.
- Ukuran Akun: Sesuai untuk ukuran akun apa pun. Ini sangat berharga bagi trader yang menjalankan beberapa strategi secara bersamaan yang perlu menjaga gambaran yang jelas.
6. Batasan dan Catatan Penggunaan Penting
- Platform: Dikembangkan secara eksklusif untuk cTrader.
- Ketersediaan Data: Tampilan perdagangan historis bergantung pada data yang tersedia dalam riwayat akun cTrader Anda.
- Bukan Generator Sinyal: Harap dicatat bahwa panel ini adalah alat analisis dan tidak menghasilkan sinyal beli atau jual independen.
Ringkasan
The panel features a compact dashboard displaying key statistics including profit in USD, total lots traded, and the R-factor. Users can customize the display period for historical trades, adjust colors and transparency of visual elements, and set calculation parameters based on fixed lot sizes or percentage risk.
Typical use cases include post-trade analysis, strategy optimization by evaluating take profit and stop loss settings, and live monitoring of daily performance without switching views. The tool supports various markets and symbols such as Forex (EURUSD, GBPUSD, USDJPY), Indices (NAS100), Commodities (XAUUSD), Crypto (BTCUSD), and Stocks. It is suitable for traders of all experience levels and account sizes, especially those managing multiple strategies simultaneously. The panel is strictly an analytical tool and does not generate trade signals.
Ulasan pelanggan
5 | 100 % | |
4 | 0 % | |
3 | 0 % | |
2 | 0 % | |
1 | 0 % |