

Deskripsi
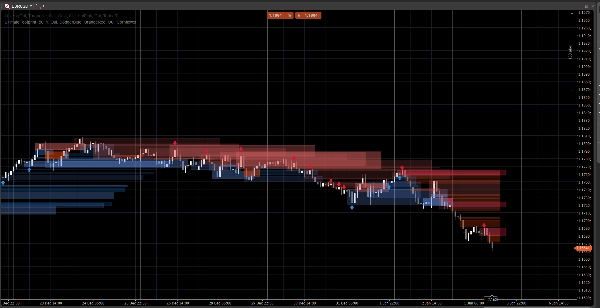
Sistem struktur pasar yang bersih yang menampilkan celah harga, blok pesanan, dan sinyal berbasis breakout, dengan konfirmasi volume opsional dan peringatan retest. Dibangun untuk kejelasan pada grafik standar dan Renko.
Indikator ini fokus pada keterbacaan dan eksekusi, bukan kekacauan. Zona diperpanjang ke depan dan dikelola secara otomatis (kedaluwarsa / pembatalan), membantu Anda melacak level yang penting saat harga berkembang.
Apa yang dideteksi
Celah Harga (ketidakefisienan 3-bar)
- Menyoroti celah bullish dan bearish langsung di grafik
- Tampilan opsional (aktif/nonaktif)
Blok Pesanan (lilin berlawanan terakhir sebelum perpindahan)
- Zona OB bullish dan bearish
- Diperpanjang secara otomatis ke depan sampai dibatalkan / pencapaian ekstensi maksimum
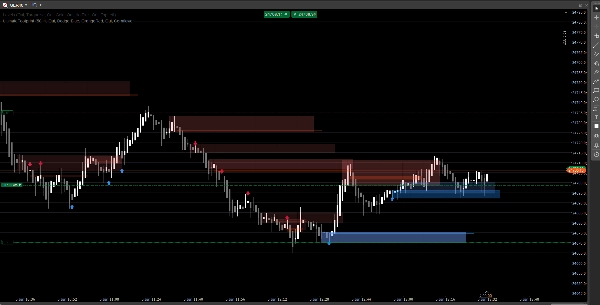
Sinyal Break Struktur (logika breakout ayunan)
- Deteksi berbasis breakout menggunakan swing high/low
- Mencetak panah sinyal (naik/turun) saat blok pesanan baru dikonfirmasi
Pembaruan waktu nyata
- Dirancang untuk terus memperbarui dengan lancar dalam kondisi langsung
- Bekerja pada lilin klasik dan berperilaku baik pada aksi harga gaya Renko
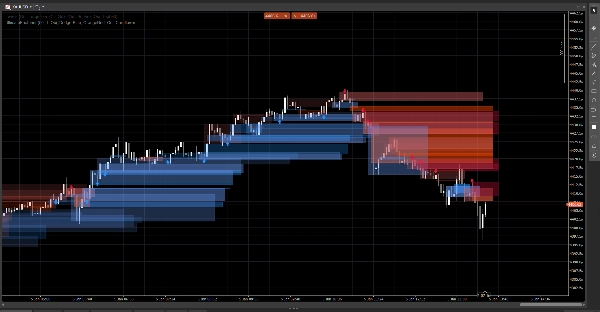
Penyaringan cerdas (opsional)
Konfirmasi volume
- Anda dapat mengharuskan konfirmasi skor-Z volume sebelum memvalidasi sinyal blok pesanan
- Garis dasar dan sensitivitas yang dapat disesuaikan
Peringatan (opsional)
Aktifkan peringatan untuk:
- Blok pesanan baru terdeteksi
- Retest blok pesanan dengan arah (lilin penolakan)
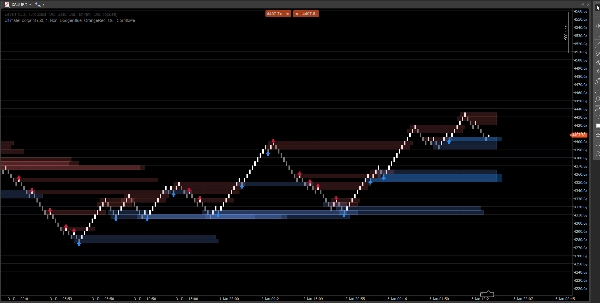
Cara menggunakannya (alur kerja sederhana)
- Gunakan Celah Harga dan Blok Pesanan sebagai zona reaksi (area yang menarik).
- Biarkan Sinyal menyoroti break struktur dan pembentukan OB yang sesuai.
- Gunakan peringatan retest untuk menangkap kembalinya ke zona dengan perilaku penolakan.
- Gabungkan dengan entri/keluar Anda sendiri (manajemen risiko tetap milik Anda).
Ikhtisar input
Logika Volume
- Garis Dasar Volume: periode perataan yang digunakan untuk perhitungan skor-Z
- Sensitivitas Volume: mengontrol seberapa kuat volume memengaruhi visibilitas zona
Celah Harga
- Tampilkan Celah Harga
- Warna Celah Bullish / Bearish
Blok Pesanan
- Tampilkan OB
- Warna OB Bullish / Bearish
- Ekstensi Maksimum: seberapa jauh zona diperpanjang ke depan
Sinyal
- Tampilkan Panah
- Lookback Swing: menentukan jendela deteksi swing
- Memerlukan Konfirmasi Volume (opsional)
- Ambang Volume + Periode Volume
- Warna Sinyal
- Transparansi Zona
- Bar Ekstensi Maksimum (sinyal)
Peringatan
- Aktifkan Peringatan
- Peringatan OB Baru
- Peringatan Retest
FAQ
1) Apakah ini repaint?
Tidak.
Indikator tidak “memindahkan” sinyal historis ke lokasi baru setelah bar ditutup.
- Zona (Celah / persegi OB) dibuat dari bar historis dan kemudian diperpanjang ke depan.
- Sinyal (panah) dikonfirmasi dari kondisi bar tertutup (break swing + seleksi OB).
Setelah panah dicetak, tidak dipindahkan secara retroaktif.
Nuansa penting (perilaku normal):
Saat bar saat ini masih terbentuk, harga (High/Low/Close) masih bisa berubah. Ini dapat menyebabkan:
- zona memperbarui ekstensi tepi kanannya (ekstensi visual),
- kondisi retest sementara benar lalu salah pada bar yang sama yang sedang terbentuk.
Itu bukan repaint—itu pembaruan waktu nyata pada lilin yang belum selesai.
2) Apa perbedaan antara “redraw” dan “repaint” di sini?
Redraw = ya (sesuai desain).
Repaint = tidak.
- Redraw berarti persegi panjang digambar ulang/diperpanjang di grafik sehingga zona terus memproyeksikan ke masa depan. Ini diperlukan untuk overlay gaya “footprint” langsung.
- Repaint berarti indikator mengubah sinyal yang sudah dikonfirmasi di masa lalu (panah/zona) setelah kejadian. Ini tidak terjadi.
3) Mengapa zona terkadang berubah bentuk atau opasitas?
Karena zona ditimbang volume menggunakan model skor-Z:
SMA(volume)+StdDev(volume)selama periode garis dasar Anda- skala opasitas/alpha mengikuti deviasi volume
Jadi jika Anda mengubah:
- Garis Dasar Volume
- Sensitivitas Volume
- atau umpan simbol berbeda
Intensitas visual dapat berbeda. Lokasi zona tetap berbasis harga; visibilitas dapat mencerminkan konteks volume.
4) Mengapa beberapa peringatan terkadang “hilang” atau “mati”?
Ada 3 alasan teknis, dan semuanya disengaja:
A) Peringatan memerlukan kondisi konfluensi ketat
Untuk peringatan retest, indikator mengharuskan:
- harga tumpang tindih dengan zona OB, DAN
- kondisi lilin penolakan terpenuhi (contoh: penolakan bullish memerlukan
Close > Open)
Jika harga menyentuh zona tapi ditutup netral / berlawanan, tidak ada peringatan retest yang dipicu.
B) Logika peringatan satu kali (anti-spam)
Setiap OB memiliki flag internal (misal: Alerted) sehingga Anda tidak mendapatkan peringatan berulang pada setiap tick.
Jadi jika sentuhan pertama tidak memenuhi aturan penolakan, dan kemudian memenuhi tapi flag sudah disetel (tergantung versi Anda), bisa terlihat “mati”.
C) Perilaku tipe grafik (Renko / agregasi tick)
Pada Renko, “batu bata saat ini” bukan lilin klasik. Selama pembentukan:
- Open/Close bisa tidak stabil atau sama
- logika retest mungkin terjadi intrabar tapi tidak dikonfirmasi saat penutupan
Dalam trading langsung, untuk keandalan maksimum:
- Peringatan OB baru biasanya bersih
- Peringatan retest sebaiknya dianggap sebagai peringatan “penolakan terkonfirmasi” (bukan hanya sentuhan sumbu)
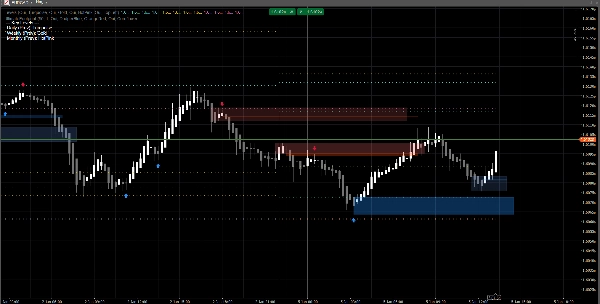
5) Dalam tangkapan layar: mengapa beberapa OB tidak menunjukkan panah (atau mengapa panah tidak cocok dengan setiap OB)?
Karena zona dan panah bukan mesin yang sama:
- Zona (persegi OB) dapat ditampilkan dari logika deteksi zona (OB turunan celah / zona aksi harga).
- Panah hanya dicetak saat peristiwa struktur terdeteksi:
-
- swing high/low terputus (Break of Structure),
- kemudian algoritma mencari ke belakang untuk menemukan lilin berlawanan terakhir = OB yang valid.
Jadi Anda mungkin melihat zona OB tanpa panah jika:
- tidak ada break swing yang tervalidasi,
- kandidat OB tidak memenuhi filter volume (jika diaktifkan),
- atau itu adalah zona yang dibuat oleh mesin celah tapi tidak dikonfirmasi oleh mesin struktur.
Inilah alasan alat ini berguna:
Zona memberi Anda peta. Panah menyoroti momen konfluensi tertinggi.
6) Bisakah saya memaksa OB selalu cocok dengan panah?
Ya, secara teknis Anda dapat menjalankannya dalam mode “hanya sinyal” dengan menonaktifkan lapisan zona yang tidak Anda inginkan:
- Matikan Celah Harga jika Anda hanya menginginkan zona yang didorong oleh struktur
- Matikan Tampilkan OB (zona) jika Anda hanya menginginkan OB yang dikonfirmasi panah
7) Apakah ini bekerja pada semua timeframe dan simbol?
Ya, tetapi hasil tergantung pada:
- volatilitas,
- likuiditas,
- kualitas volume tick,
- dan sesi pasar.
Crypto dan indeks berperilaku berbeda dari FX.
Catatan & Penafian
Indikator ini adalah alat pendukung keputusan visual, bukan layanan sinyal dan bukan nasihat keuangan.
Semua pasar dan timeframe berperilaku berbeda — selalu validasi pada data Anda dan kelola risiko dengan tepat. Perilaku masa lalu tidak menjamin hasil di masa depan.
Ringkasan
Ulasan pelanggan
5 | 100 % | |
4 | 0 % | |
3 | 0 % | |
2 | 0 % | |
1 | 0 % |


![Logo "Gaussian Channel [Iridio Capital]"](https://cdn.ctrader.com/image/webp/7c039209-5573-4a54-a072-f9528b503103_41960)


