Deskripsi
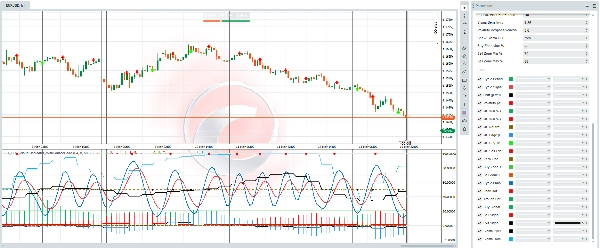
Sebagian besar trader mengandalkan indikator tertinggal yang bereaksi terhadap harga setelah pergerakan terjadi. FFT-SDE Visual Engine mengambil pendekatan kuantitatif yang secara fundamental berbeda. Ini bukan hanya sebuah osilator; ini adalah rangkaian pemrosesan sinyal dan peramalan waktu nyata yang dibangun langsung ke dalam cTrader.
Ini beroperasi berdasarkan dua prinsip inti:
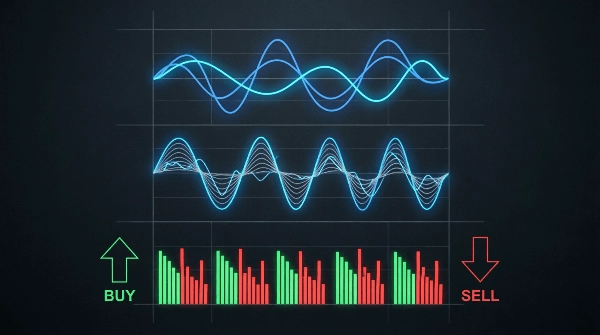
- Pasar memiliki Irama (Siklus): Dengan menggunakan analisis Fast Fourier Transform (FFT), indikator memecah aksi harga menjadi komponen frekuensi inti, menyaring noise untuk mengungkap siklus dominan yang dapat diperdagangkan. Ini memberi tahu Anda kapan pasar kemungkinan akan berbalik.
- Pergerakan Harga memiliki Sifat Statistik (SDE): Dengan memodelkan harga sebagai Persamaan Diferensial Stokastik (proses Ornstein-Uhlenbeck), ini mengkuantifikasi drift (momentum), volatilitas (risiko), dan kecepatan mean-reversion pasar. Ini memberi tahu Anda bagaimana pasar kemungkinan akan bergerak dan probabilitas dari perdagangan yang berhasil.
Dengan menggabungkan kedua dunia ini—Analisis Siklus (FFT) dan Peramalan Stokastik (SDE)—mesin FFT-SDE memberikan pandangan holistik tentang pasar yang tidak tersedia dalam alat standar.
2. Utilitas Inti: Masalah Apa yang Diselesaikan?
Berikut cara seorang trader dapat menggunakan indikator ini untuk meningkatkan pengambilan keputusan mereka:
- Masalah 1: "Saya tidak bisa membedakan apakah pasar sedang tren atau hanya bergerak sideways."
-
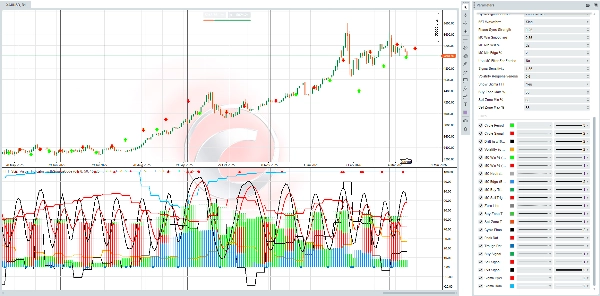
- Solusi (Periode Siklus & Sigma Siklikalitas): Histogram Periode Siklus langsung menunjukkan panjang siklus pasar dominan saat ini. Ketika siklus jelas dan kuat, Anda dapat memperdagangkan ayunan. Ketika Sigma Siklikalitas % (siklus volatilitas) tinggi, Anda tahu untuk mengharapkan periode ekspansi dan kontraksi risiko, memungkinkan Anda menyesuaikan ukuran posisi secara dinamis.
- Masalah 2: "Entri saya selalu terlalu awal atau terlambat."
-
- Solusi (Fase Siklus & Zona Entri): Indikator memetakan siklus pasar ke gelombang halus 0-100%— Fase Siklus % . Alih-alih menebak puncak dan dasar, Anda dapat menunggu harga memasuki Zona Beli (0-35%) dan Zona Jual (60-88%). Ini bukan level sembarangan; mereka secara dinamis diturunkan dari frekuensi dominan pasar sendiri, memberi Anda keunggulan waktu yang signifikan.
- Masalah 3: "Saya tidak tahu apakah sebuah setup memiliki probabilitas keberhasilan yang tinggi."
-
- Solusi (Simulasi Monte Carlo): Ini adalah fitur utama. Untuk setiap bar, mesin menjalankan ratusan jalur harga simulasi (Monte Carlo) berdasarkan dinamika pasar saat ini. Kemudian menghasilkan MC Win % (Beli) dan MC Win % (Jual) . Ini bukan perasaan atau firasat; ini adalah probabilitas statistik dari perdagangan risiko-imbalan 1:2,5 yang berhasil sebelum Anda bahkan masuk. Anda benar-benar dapat melihat apakah peluang ada di pihak Anda.
- Masalah 4: "Indikator standar terlalu lambat dan berisik."
-
- Solusi (Adaptif & Multi-Faset): Indikator ini tidak statis. Model Volatilitas Adaptif merespons secara waktu nyata terhadap guncangan harga dan impuls siklus. Sigma FFT memberi tahu Anda jika volatilitas itu sendiri menjadi siklikal, memperingatkan Anda tentang periode tenang atau eksplosif yang akan datang. Setiap komponen dirancang untuk beradaptasi dengan kondisi pasar saat ini.
Anda tidak akan menemukan indikator lain di pasar cTrader yang menggabungkan fitur-fitur ini menjadi satu sistem yang koheren dan visual.
- Lapisan "Sigma FFT": Mengetahui bahwa harga memiliki siklus adalah satu hal. Mengetahui bahwa volatilitas itu sendiri memiliki siklus adalah tingkat kecanggihan yang baru. Ini memberikan keunggulan besar dalam mengantisipasi perubahan struktur pasar.
- Keunggulan Probabilistik, Bukan Kepastian: Output Monte Carlo menggeser trader dari mencari kepastian "holy grail" menuju pola pikir profesional dalam mengelola probabilitas dan keunggulan.
- Sepenuhnya Visual & Dapat Disesuaikan: Semua matematika kompleks ini disajikan dalam format multi-panel yang bersih dengan kustomisasi luas (27+ parameter). Anda dapat menyesuaikannya dengan gaya trading spesifik Anda, dari scalping hingga swing trading.
- Fusi Koheren: Fase siklus yang menghasilkan sinyal beli/jual Anda adalah sama siklus yang digunakan untuk menghitung drift dan volatilitas adaptif. Setiap bagian dari indikator saling berhubungan, menciptakan model pasar yang terpadu dan konsisten.
Indikator ini sempurna untuk trader yang:
- Bosanan dengan indikator tertinggal dan menginginkan pendekatan yang lebih prediktif dan ilmiah.
- Memiliki pemahaman tentang siklus, volatilitas, dan nilai probabilitas statistik.
- Ingin membangun sistem trading berbasis aturan yang kuat.
- Memperdagangkan instrumen dengan perilaku siklikal (misalnya, pasangan Forex, Indeks, Komoditas seperti Emas).
- Bersedia berinvestasi dalam alat kelas profesional untuk mendapatkan keunggulan nyata di pasar.
FFT-SDE Visual Engine mengubah konsep keuangan kuantitatif yang kompleks menjadi alat trading yang praktis dan dapat ditindaklanjuti. Ini membawa Anda dari menebak menjadi mengetahui, dari bereaksi menjadi mengantisipasi. Jika Anda siap untuk berdagang dengan pemahaman yang lebih dalam tentang struktur pasar dan keunggulan probabilistik yang dapat diukur, inilah mesin yang Anda tunggu-tunggu.
Ringkasan
Ulasan pelanggan
5 | 67 % | |
4 | 33 % | |
3 | 0 % | |
2 | 0 % | |
1 | 0 % |