
Deskripsi
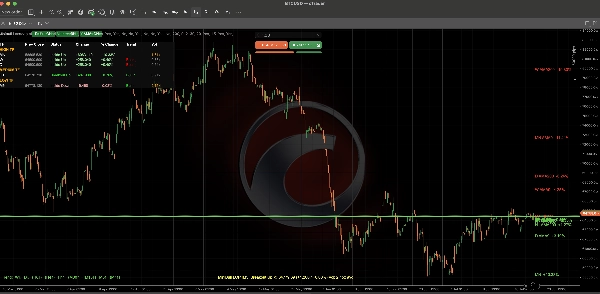
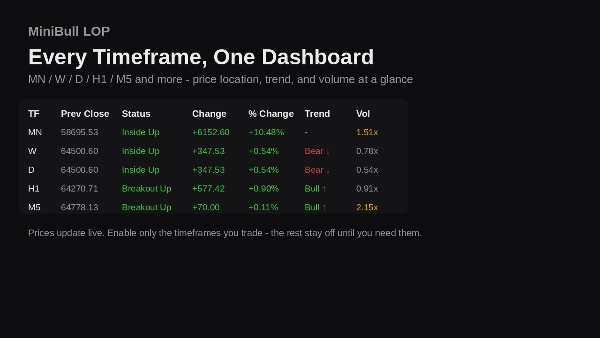
MiniBull Lokasi Harga (LOP) menunjukkan dengan tepat di mana harga berada dibandingkan dengan bar tertutup terakhir di setiap kerangka waktu yang penting: Bulanan, Mingguan, Harian, H8, H4, H1, M30, M15, M5, M1 (dapat dikonfigurasi; lima aktif secara default).
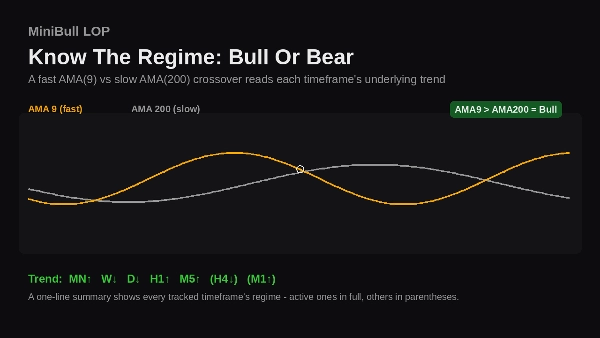
Untuk setiap kerangka waktu: penutupan sebelumnya, perubahan absolut dan %, pembacaan tren Bull/Bear dari persilangan AMA ganda (9/200), dan rasio volume tick dibandingkan rata-ratanya sendiri, dalam satu dasbor di grafik yang dapat diaktifkan dengan satu klik.
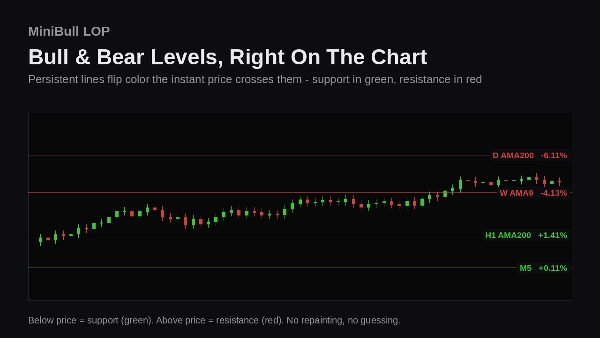
Garis berwarna yang persisten (hijau = support, merah = resistance) menandai setiap level di grafik dan diperbarui secara langsung, sehingga Anda selalu tahu posisi harga tanpa membuka jendela tambahan.
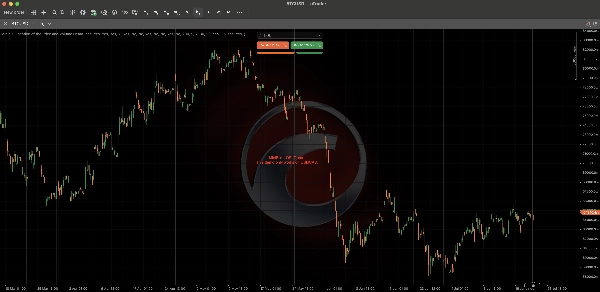
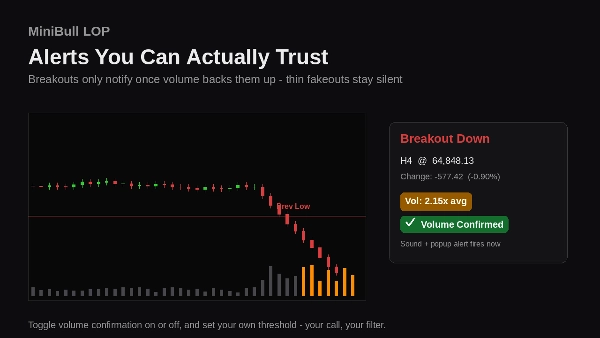
Peringatan breakout (suara + popup) aktif saat harga melewati titik tertinggi atau terendah sebelumnya, dengan opsi memerlukan konfirmasi volume, menyaring fakeout tipis dan kurang meyakinkan.
Ringkasan tren yang ringkas di bagian bawah grafik memberikan pembacaan suasana pasar satu baris di setiap kerangka waktu yang dilacak, aktif atau tidak.
Dibuat untuk trader yang berpikir lintas kerangka waktu: mengenali keselarasan, mengenali divergensi, tidak pernah kehilangan jejak harga dibandingkan kemarin, minggu lalu, atau bulan lalu.










![Logo "Wyckoff Toolkit [Iridio Capital]"](https://cdn.ctrader.com/image/webp/5318c788-91ef-4297-bca6-4ce73b1516a8_61556)