present
Daftar dan dapatkan potongan bernilai $50 untuk pembelian pertama anda
Trading product for LSVR Pro Indikator Fibonacci Key Levels, image 1
LSVR Pro
Indikator
1 pembelian
Versi 1.0, Sep 2026
Windows, Mac
4.5
Ulasan: 4
Trading product for LSVR Pro Indikator Fibonacci Key Levels, image 2
Trading product for LSVR Pro Indikator Fibonacci Key Levels, image 3
Trading product for LSVR Pro Indikator Fibonacci Key Levels, image 4
Trading product for LSVR Pro Indikator Fibonacci Key Levels, image 5
Sejak 04/09/2026
1
Jualan

Penerangan

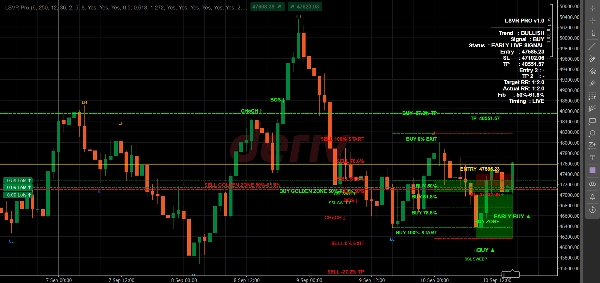
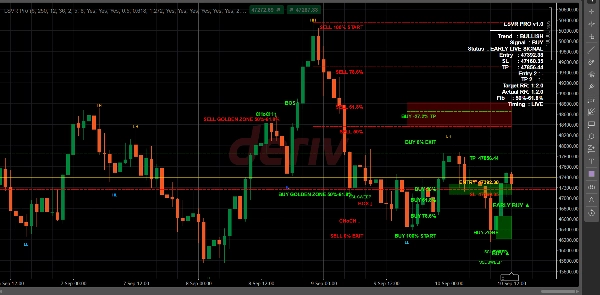
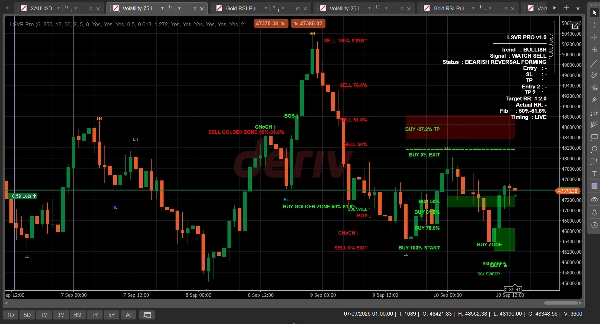
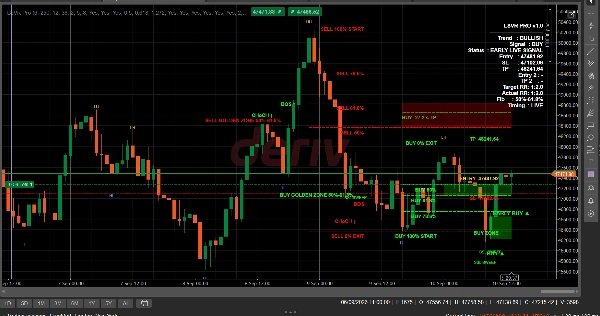
LSVR Pro adalah penunjuk struktur pasaran berasaskan carta yang direka untuk membantu pedagang mengenal pasti arah aliran potensi, zon harga utama dan persediaan perdagangan yang disahkan.

Ia menyediakan rangka kerja visual yang jelas untuk menganalisis tindakan harga tanpa meletakkan perdagangan secara automatik. Penunjuk ini bertujuan untuk menyokong pembuatan keputusan yang berdisiplin, bukan menggantikan pengurusan risiko atau analisis bebas.

Ciri-ciri utama:

• Panduan struktur pasaran, termasuk petunjuk visual Break of Structure (BOS)
• Pengenalpastian zon beli dan jual untuk menyerlahkan kawasan reaksi potensi
• Tahap rujukan berasaskan Fibonacci, termasuk tahap 100% dan 78.6%
• Logik isyarat lilin yang disahkan untuk mengurangkan perubahan isyarat intrabar
• Visual jelas pada carta yang direka untuk analisis pantas
• Sesuai untuk menyemak persediaan merentasi instrumen dan jangka masa yang berbeza
• Fokus pada perdagangan manual, tiada pesanan automatik diletakkan

LSVR Pro direka untuk pedagang yang mahukan cara berstruktur untuk mengkaji tindakan harga, menilai kemasukan potensi dan mengurus idea perdagangan dengan konsistensi yang lebih tinggi.

Cara menggunakan:

  1. Gunakan LSVR Pro pada carta pilihan anda.
  2. Pilih jangka masa pilihan anda.
  3. Semak arah struktur pasaran dan zon yang diserlahkan.
  4. Tunggu pengesahan lilin sebelum membuat keputusan perdagangan.
  5. Sentiasa tentukan stop loss, ambil untung dan saiz posisi anda sendiri.

Penting: LSVR Pro adalah alat analisis sahaja. Perdagangan melibatkan risiko, dan prestasi atau isyarat lalu tidak menjamin keputusan masa depan. Pengguna harus menguji penunjuk pada akaun demo dan menggunakan pengurusan risiko yang sesuai sebelum berdagang secara langsung.

Ringkasan

Ringkasan AI
LSVR Pro is a chart-based market structure indicator designed to assist traders in analyzing price action and identifying potential trend directions, key price zones, and confirmed trade setups. It provides visual cues for Break of Structure (BOS), liquidity sweeps, and smart buy/sell zones with suggested entry, stop loss (SL), and take profit (TP) levels. The indicator incorporates Fibonacci-based reference levels, including 100% and 78.6% retracements, to highlight important price areas.

LSVR Pro uses confirmed-candle signal logic to minimize intrabar signal fluctuations, offering clear on-chart visuals for fast and structured analysis. It supports multiple instruments and timeframes, focusing on manual trading without placing automatic orders. Traders apply the indicator to their preferred charts and timeframes, review market structure and highlighted zones, and wait for candle confirmation before making trading decisions. Users are responsible for defining their own risk management parameters such as stop loss, take profit, and position sizing.

This tool is intended to support disciplined decision-making by providing a structured framework for reviewing price action, assessing potential entries, and managing trade ideas consistently. It is an analytical tool only and does not guarantee trading outcomes.
Profil indikator
Kategori indikator
Struktur pasaran (SMC)
Jenis output
Visualisasi
Isyarat
Keperluan data
Bar sahaja
Isyarat yang disokong
Terobosan
Pembalikan
Sentuhan paras

Perbincangan

Ulasan pelanggan

4.5
Ulasan: 4
5
50 %
4
50 %
3
0 %
2
0 %
1
0 %
Ulasan pelanggan
October 30, 2026
The Fibonacci levels are more informative when read alongside the structure markings. Confirmed candle signals set a clear pace for the overlay rather than responding to every intrabar movement. A useful visual framework for manual analysis.
October 17, 2026
Confirmed candle signals, BOS context and highlighted zones give the 78.6% and 100% Fibonacci references a coherent manual analysis framework rather than leaving the levels floating on their own.
October 13, 2026
BOS and highlighted zones give the 78.6% and 100% references useful context. Waiting for a confirmed candle keeps the signal tied to a completed setup. It remains a manual overlay, with position sizing and exits decided separately.
October 4, 2026
LSVR Pro displayed BOS/CHoCH structures, liquidity sweeps, Fibonacci levels, BUY/SELL zones, and a setup status panel across EURUSD H1 and XAUUSD H1/M1. The XAUUSD H1 setup showed consistent Entry, SL, TP, and a 1:2 risk/reward ratio. The indicator is informative, although overlapping labels can reduce readability on busy charts. A useful market-structure analysis tool.

Soalan Lazim

Fibonacci
Key Levels
BOS
Liquidity Sweep
Market Structure
Support & Resistance
Produk yang tersedia melalui cTrader Store, termasuk bot dagangan, indikator dan plugin, disediakan oleh pembangun pihak ketiga dan diberikan akses untuk tujuan maklumat dan teknikal sahaja. cTrader Store bukan broker dan tidak memberikan nasihat pelaburan, syor peribadi atau sebarang jaminan prestasi masa hadapan.

Anda juga mungkin suka

Indikator
ATR
RSI
+5
Multi-timeframe trend indicator using EMA, MACD & ADX to confirm high-probability buy and sell bias.
Indikator
Forex
Indices
+5
Market Profile TPO for cTrader — full auction logic, IB, POC, VA zones, histogram and O/X markers with time
Indikator
EMA
SMA
+5
Trend Blueprint All-in-One Trend & Structure
Indikator
AI-assisted
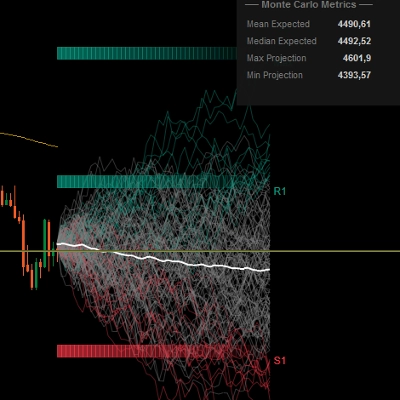
Predictive Monte Carlo Engine Forecast future price paths using institutional-grade statistical models and probability
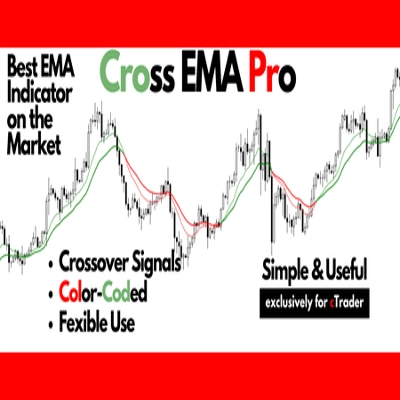
Logo "Cross EMA Pro"
Dinilai teratas
4.4
(5)
$49
Indikator
Forex
BTCUSD
+5
Cross EMA Pro – Trend Reversal Indicator
Indikator
SMC
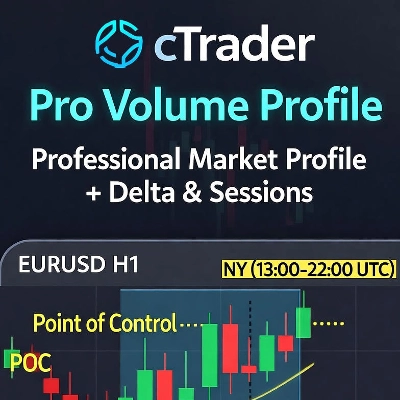
Pro Volume Profile with Delta, Session Filters & CSV Export. Precision order flow analysis.
Indikator
Key Levels
Trend-filtered signals, transparent trade plans and a multi-timeframe decision panel for cTrader.
Indikator
SMC
Grid
+19
Smart fractals + auto Fibonacci + dynamic S/R zones with HTF confluence & Bull/Bear bias panel. Institutional-grade.
Indikator
Prop
Forex
+5
Tick Imbalance Bars Indicator - brings institutional-grade market microstructure analysis to cTrader.
Indikator
Imbalance
Fair Value Gap
+4
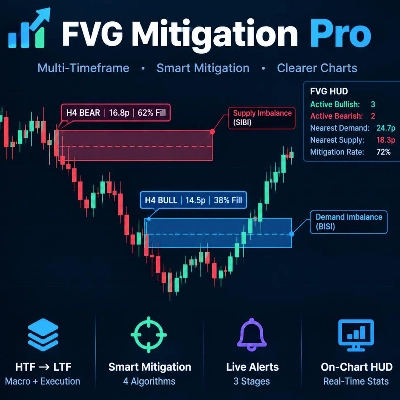
Fair Value Gap scanner with live fill telemetry, 50% CE lines, 4 mitigation rules, and a 3-stage native alert system.
Indikator
Forex
Crypto
+4
Statistical boundaries that adapt to real-time volatility for a better risk management.
Indikator
Fibonacci
Key Levels
+1
Explore Elliott wave counts, three swing sizes and example levels with an interactive cTrader chart panel.
Indikator
AI
ATR
+26
The Triple Momentum indicator for cTrader is a versatile trend-following tool.
Indikator
SMC
Prop
+5
Order Block PRO — Smart Institutional Zone Detector
Indikator
ATR
RSI
+2
This indicator works best as a trend-confirmation tool—wait for multiple signals!
Indikator
Prop
Forex
+12
Multi-timeframe liquidity heatmap. Visualizes pivot zones across 10 timeframes with density mapping for Smart Money trad
Indikator
Key Levels
Order Block
+3
Professional indicator for automated detection and dynamic tracking of Supply & Demand zones in cTrader.
Indikator
Forex
BTCUSD
+5
Daily/Weekly/Monthly - Highs & Lows Indicator (Customizable Settings)

Harga

Sejak 04/09/2026
1
Jualan