
Volume_Momentum_HeatMap-Liquidity-style
Indikator
Versi 2.0, Apr 2026
Windows, Mac
4.5
Ulasan: 4
Deskripsi
Mengapa Indikator Ini Berharga bagi Pedagang
- Mengidentifikasi Level Kunci: POC, VAH, dan VAL adalah level support/resistance yang objektif.
- Perdagangan Berbasis Volume: Membantu pedagang melihat di mana likuiditas terkonsentrasi.
- Dapat Disesuaikan: Bekerja pada kerangka waktu dan kelas aset apa pun (forex, saham, kripto, dll.).
- Dapat Dikustomisasi: Pedagang dapat mengatur pengaturan agar sesuai dengan gaya mereka.
- Kelas Profesional: Digunakan oleh pedagang institusional dan ritel untuk analisis aliran pesanan.
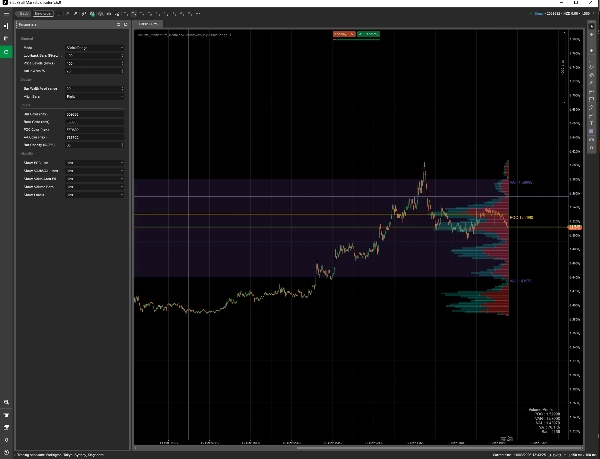
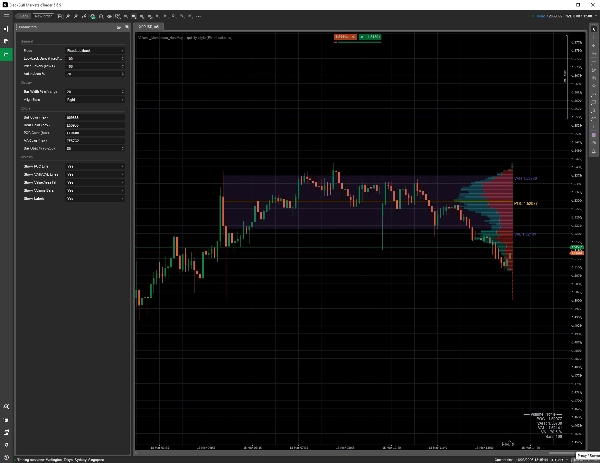
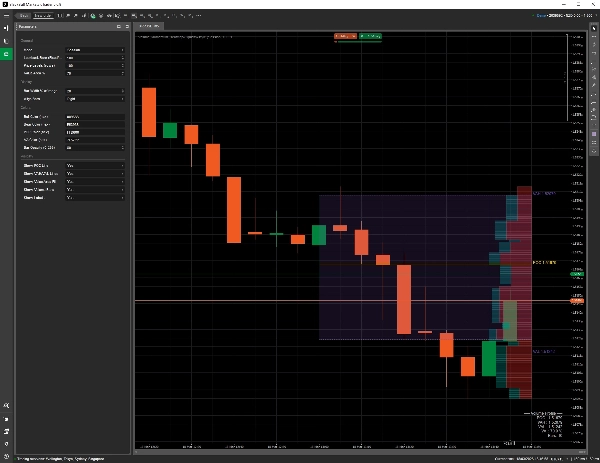
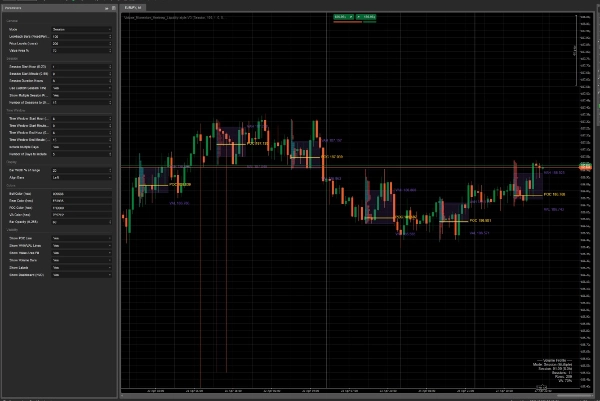
Elemen Visual - POC (Point of Control): Level harga dengan volume tertinggi (garis kuning). Bertindak sebagai magnet untuk harga.
- VAH/VAL (Value Area High/Low): Batas atas dan bawah dari area nilai 70% (default), di mana 70% volume terjadi. Area ini sering bertindak sebagai support/resistance.
- Isi Area Nilai: Sebuah pita semi-transparan antara VAH dan VAL, menyoroti area nilai secara visual.
- HVN (High Volume Nodes): Batang lebar yang menunjukkan zona support/resistance yang kuat.
- LVN (Low Volume Nodes): Batang tipis yang menunjukkan area di mana harga bergerak cepat (zona breakout/stop-run).
2. Mode Profil
- Rentang Terlihat: Menyesuaikan dengan tampilan grafik saat ini (zoom/scroll).
- Lookback Tetap: Menggunakan N batang terakhir (dapat dikonfigurasi).
- Sesi: Hanya menampilkan volume untuk hari perdagangan saat ini.
3. Opsi Kustomisasi
- Baris: Jumlah level harga (baris) yang ditampilkan.
- Persentase Area Nilai: Sesuaikan persentase volume yang termasuk dalam area nilai (default: 70%).
- Lebar & Penjajaran Batang: Kontrol lebar dan penjajaran batang volume.
- Warna & Opasitas: Sesuaikan warna untuk volume bull/bear, POC, VA, dan opasitas.
- Visibilitas: Aktifkan/nonaktifkan POC, VAH/VAL, isi area nilai, batang volume, dan label.
4. Strategi Perdagangan yang Didukung
- Retracement HVN: Perdagangkan pantulan di POC atau node volume tinggi.
- Breakout LVN: Masuk perdagangan momentum saat harga menembus node volume rendah.
- Fade Area Nilai: Melawan pergerakan di luar area nilai (mean-reversion).
- Bias Pembukaan Harian: Bandingkan pembukaan harian dengan POC untuk arah tren.
Pertanyaan & Jawaban Calon Pembeli
- T: Apakah ini bekerja pada semua kerangka waktu?
J: Ya, ini menyesuaikan dengan kerangka waktu dan tampilan grafik apa pun. - T: Bisakah saya mengubah warnanya?
J: Ya, semua warna dan opasitas dapat dikustomisasi. - T: Apakah ini cocok untuk scalping?
J: Tentu saja, terutama dengan mode “Sesi” untuk perdagangan intraday. - T: Apakah ini melakukan repaint?
J: Tidak, ini hanya menghitung ulang saat data baru tersedia atau tampilan grafik berubah.
Ringkasan
Profil indikator
Kategori indikator
Momentum
Tipe output
Visualisasi
Persyaratan data
Volume
Sinyal yang didukung
Volatilitas
Level tersentuh
Rentang sesi pembukaan
Ulasan pelanggan
4.5
Ulasan: 4
5 | 50 % | |
4 | 50 % | |
3 | 0 % | |
2 | 0 % | |
1 | 0 % |
Ulasan pelanggan
March 31, 2026
Not some auto win thing, but it has a clear role. It helps with smart money style analysis, while the weak spot is that zones still need manual validation. Early sizing should stay modest until the journal looks stable.
March 24, 2026
Tbh the value is mostly in filtering bad ideas. I still would not trust it live without checking the chart myself. The weak spot shows up when risk stops matching the setup.705 caution area.
March 22, 2026
the product feels more useful when the plan is already written down. A 97 setup run on daily close keeps the review grounded.
March 22, 2026
After 3 sessions, the useful part became clearer. 20 FVG reactions was enough to see whether it helped, and 0.5 mitigation kept the test grounded.
Diskusi
Pertanyaan umum
Scalping
Produk-produk yang tersedia melalui cTrader Store, termasuk bot trading, indikator, dan plugin, disediakan oleh pengembang pihak ketiga serta hanya ditujukan untuk akses teknis dan informasi. cTrader Store bukan broker dan tidak menyediakan saran investasi, rekomendasi pribadi, atau jaminan apa pun tentang kinerja di masa mendatang.
Produk lain dari penulis ini


Harga
Sejak 23/04/2025
2
Penjualan