Deskripsi
MACRO ZERO — KUARTAL & SESI MINGGUAN Bagian dari Suite MACRO ZERO
Analisis siklus kuartalan dan pola musiman mingguan di berbagai instrumen dengan data bias historis dan pelacakan intra-minggu waktu nyata untuk keputusan perdagangan tingkat makro.
APA YANG DILAKUKANNYA
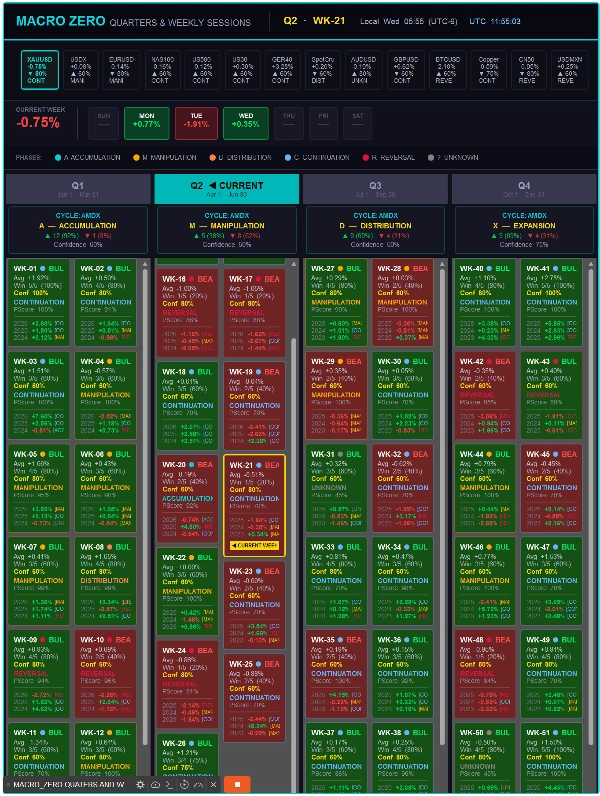
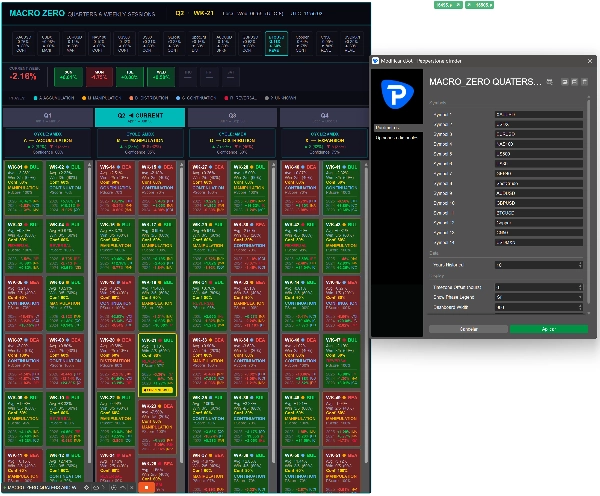
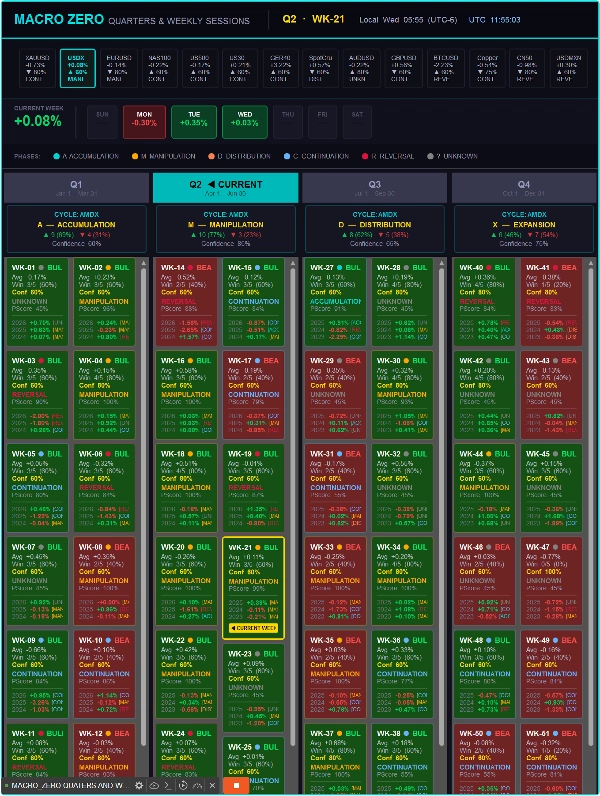
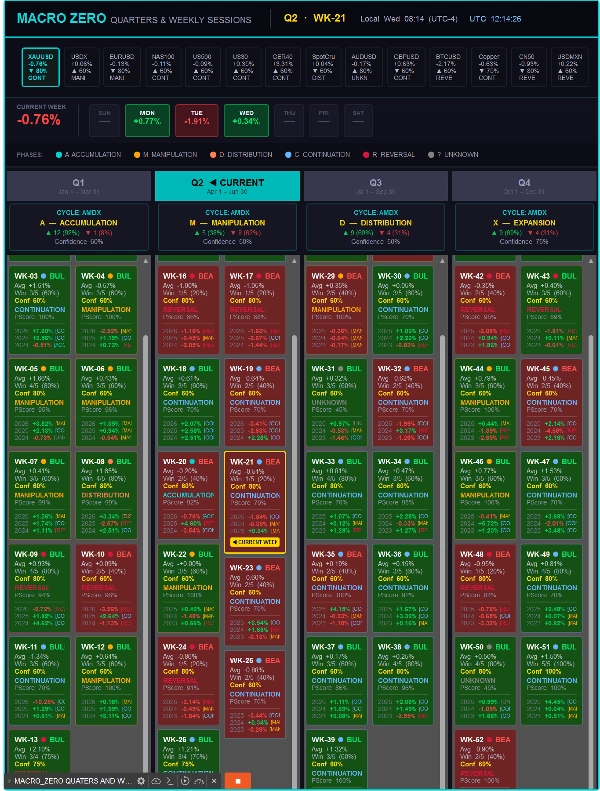
Menampilkan dasbor analisis musiman lengkap pada grafik Anda, membagi tahun menjadi 4 kuartal dan 52 minggu — masing-masing dengan bias arah historis, tingkat kemenangan, rata-rata pengembalian, dan klasifikasi fase. cBot secara otomatis mengidentifikasi kuartal dan minggu saat ini dan menunjukkan bagaimana periode yang sama berkinerja secara historis di hingga 14 simbol yang dapat dikonfigurasi dalam satu tampilan. Ketersediaan data historis tergantung pada broker Anda; konfigurasikan antara 3 hingga 20 tahun data historis di pengaturan.
JANGKAUAN SIMBOL
Pantau hingga 14 instrumen yang sepenuhnya dapat dikonfigurasi termasuk forex, komoditas, indeks, dan cryptocurrency. Masukkan simbol apa pun persis seperti yang muncul di platform broker Anda — ketersediaan tergantung pada broker Anda. Simbol yang tidak ditemukan akan dilewati secara otomatis. Slot default termasuk XAUUSD, EURUSD, NAS100, BTCUSD, dan lainnya sebagai referensi. Beralih antar simbol secara instan menggunakan pemilih di grafik. Crypto dan instrumen 24/7 lainnya terdeteksi secara otomatis dengan sesi akhir pekan yang dilacak sesuai.
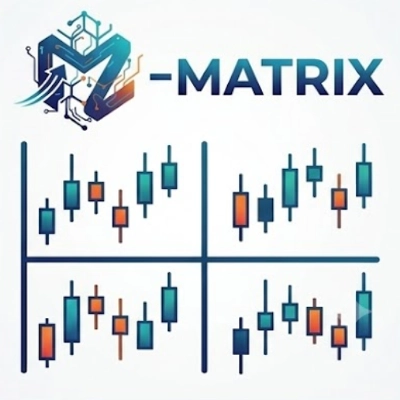
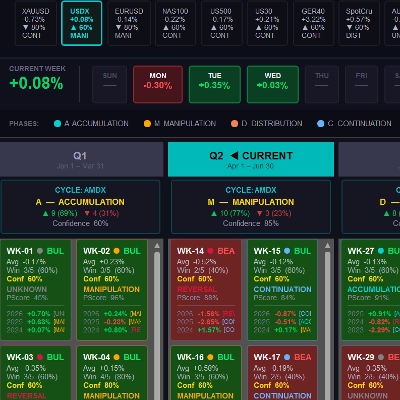
ANALISIS SIKLUS KUARTALAN
Setiap kuartal diklasifikasikan di bawah struktur siklus AMDX atau XAMD dengan jumlah minggu bullish dan bearish, persentase, dan skor kepercayaan. Skor di atas 60% menunjukkan kecenderungan arah yang berarti untuk kuartal tersebut.
MESIN MUSIMAN MINGGUAN
Setiap kartu minggu menunjukkan bias arah, rata-rata pengembalian, tingkat kemenangan, skor kepercayaan, klasifikasi fase, skor fase, dan 3 hasil tahunan individu terakhir untuk konteks historis langsung. Kepercayaan di atas 60% menunjukkan kecenderungan arah yang dapat diandalkan; di atas 80% menunjukkan konsistensi historis yang kuat. Kartu disusun dalam tata letak gulir 2 kolom per kuartal dengan minggu saat ini disorot dengan warna emas.
DETEKSI FASE
Minggu secara otomatis diklasifikasikan sebagai Akumulasi, Manipulasi, Distribusi, Kelanjutan, Pembalikan, atau Tidak Diketahui berdasarkan struktur harga, rentang, dan volume relatif terhadap minggu sebelumnya.
PEMANTAU MINGGU SAAT INI
Rincian harian langsung dari pengembalian minggu saat ini, diberi kode warna per sesi, diperbarui setiap menit. Instrumen standar menunjukkan Senin hingga Jumat; aset 24/7 menunjukkan Minggu hingga Sabtu.
BAR IKHTISAR SIMBOL
Semua 14 simbol ditampilkan secara bersamaan sebagai kartu interaktif yang menunjukkan pengembalian minggu saat ini, bias, kepercayaan, dan fase. Klik kartu mana pun untuk langsung beralih dasbor ke simbol tersebut.
CATATAN TEKNIS
Dibangun sebagai cBot cTrader untuk stabilitas maksimum — mempertahankan status saat koneksi ulang dan tidak memuat ulang saat perubahan kerangka waktu. Berjalan sepenuhnya di grafik tanpa mengeksekusi perdagangan apa pun. Memerlukan platform cTrader.
Penafian Risiko: Perdagangan instrumen keuangan melibatkan risiko kerugian yang substansial. Pola musiman masa lalu tidak menjamin hasil di masa depan. Alat ini hanya untuk tujuan analitis dan tidak merupakan nasihat keuangan. Selalu terapkan manajemen risiko yang tepat.
⚠️ Peringatan Risiko: Perdagangan instrumen keuangan melibatkan risiko kerugian yang signifikan dan mungkin tidak cocok untuk semua investor. Kinerja masa lalu tidak menunjukkan hasil di masa depan. Alat ini dirancang hanya untuk tujuan informasi dan pemantauan dan tidak merupakan nasihat keuangan. Selalu berdagang dengan bertanggung jawab dan hanya dengan modal yang Anda mampu untuk kehilangan.
Ringkasan
Key features include quarterly cycle analysis based on AMDX or XAMD structures with confidence scoring, a weekly seasonality engine presenting detailed weekly bias and performance metrics, and automatic phase detection classifying weeks into market phases such as Accumulation or Distribution. A live current week tracker offers daily return breakdowns updated every minute, accommodating both standard and 24/7 trading instruments. An interactive symbol overview bar allows quick switching between monitored instruments.
The cBot runs entirely on-chart without executing trades, maintaining stability across reconnections and timeframe changes. Historical data lookback can be configured between 3 and 20 years depending on broker availability. This tool is intended for analytical purposes and requires the cTrader platform.
Ulasan pelanggan
5 | 100 % | |
4 | 0 % | |
3 | 0 % | |
2 | 0 % | |
1 | 0 % |