Описание
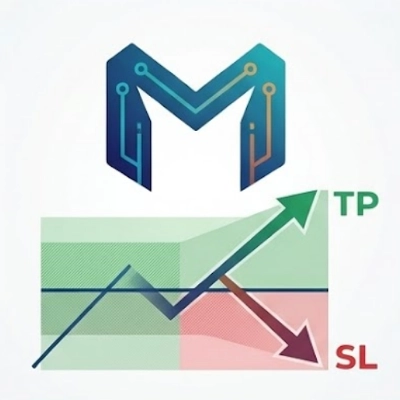
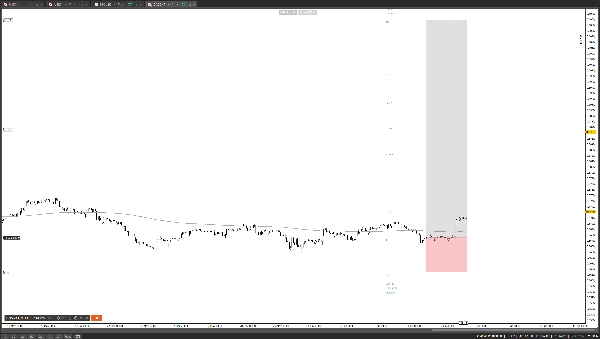
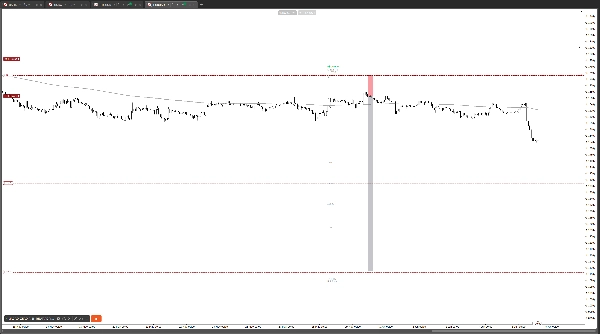
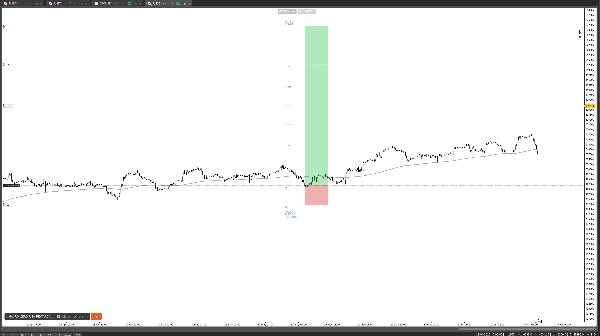
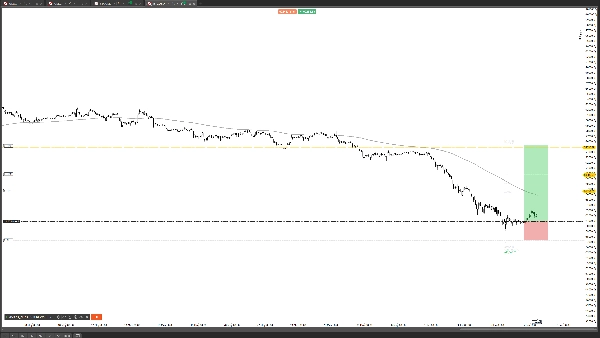
ЧТО ОН ДЕЛАЕТ Рисует визуальную рамку риск/вознаграждение для каждой активной позиции, отложенного ордера и исторической сделки по вашему символу — всё в реальном времени. cBot автоматически считывает цену входа, стоп-лосс и тейк-профит и отображает цветные прямоугольники, показывающие зоны SL и TP рядом друг с другом, чтобы вы могли мгновенно видеть уровень риска без ручных расчетов.
АКТИВНЫЕ ПОЗИЦИИ И ОТЛОЖЕННЫЕ ОРДЕРА Каждая открытая позиция и отложенный ордер с настроенными SL и TP рисуются автоматически. Рамка обновляется в реальном времени каждые 5 секунд или сразу при открытии, изменении или закрытии позиции. Отложенные ордера можно включать или отключать через параметр — отключите их, если хотите отслеживать только живые сделки.
ЦЕНОВЫЕ МЕТКИ И ИЗМЕРЕНИЯ Каждая рамка отображает: стрелку входа, уровни цен SL и TP, расстояние в пунктах от входа до SL, соотношение риск:вознаграждение (например, 1:2.50), а также текущую чистую прибыль/убыток в долларах — цветовая кодировка зелёным для прибыли и красным для убытка. Все метки можно включать и выключать независимо.
ЦЕНОВОЙ ЛИНЕЙКА Опциональная линейка накладывается на зону TP на ключевых уровнях, чтобы вы могли определить частичные цели тейк-профита и области ценового совпадения без переключения инструментов.
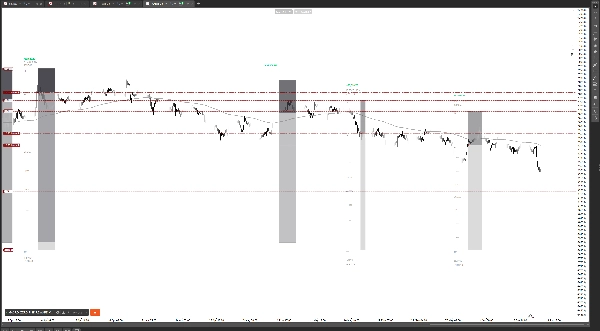
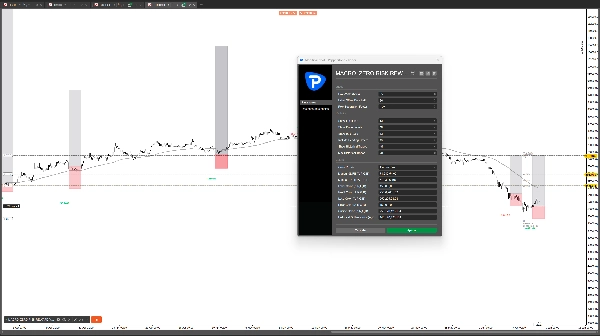
ИСТОРИЧЕСКИЕ СДЕЛКИ Включите исторический режим для отображения до 200 закрытых сделок. cBot сопоставляет каждую закрытую сделку с её исходными SL/TP по ID позиции и времени исполнения, и рисует затемнённую версию рамки с итоговым результатом P&L — предоставляя вам визуальный архив всех выполненных настроек прямо на графике.
ЦВЕТОВЫЕ ПРОФИЛИ Выбирайте из 4 встроенных цветовых профилей — Classic (красный/зелёный), DarkGray, CurrentPink или Manual — где вы задаёте каждый цвет ARGB индивидуально: заливка SL, заливка TP, метки, P&L, линейка и контур. Цвета обновляются в реальном времени при изменении параметров, перезапуск не требуется.
ТЕХНИЧЕСКИЕ ЗАМЕТКИ Создан как cBot для cTrader для максимальной стабильности — сохраняет визуальное состояние при переподключениях и реагирует на все события позиций в реальном времени. Не выполняет никаких сделок. Требуется платформа cTrader с настроенными SL и TP на ваших позициях.
⚠️ Предупреждение о рисках: Торговля финансовыми инструментами связана с высоким риском потерь и может не подходить всем инвесторам. Прошлые результаты не гарантируют будущих. Этот инструмент предназначен только для визуализации и мониторинга и не является финансовой консультацией. Всегда торгуйте ответственно и только тем капиталом, который вы можете позволить себе потерять.
Сводка
Key features include:
- Visualization of all open positions and pending orders with configured SL and TP, with an option to toggle pending orders.
- Display of entry arrows, SL and TP price levels, pip distances, risk-to-reward ratios, and current net profit or loss in dollars, with customizable label visibility.
- An optional price ruler overlaying the TP zone to highlight partial take profit targets and price confluence areas.
- Historical mode showing up to 200 closed trades with dimmed boxes indicating final P&L results.
- Four built-in color profiles and a manual mode for full color customization of all visual elements.
The cBot maintains visual state across reconnections and reacts in real time to position events. It does not execute trades and requires positions to have SL and TP configured.