MACRO_ZERO VOLUME IMBALANCE STRIP
cBot
Version 1.0, Jun 2026
Windows, Mac, Web
5.0
Reviews: 1
Trading product for MACRO_ZERO VOLUME IMBALANCE STRIP cBot Fair Value Gap Key Levels, image 2
Trading product for MACRO_ZERO VOLUME IMBALANCE STRIP cBot Fair Value Gap Key Levels, image 3
Trading product for MACRO_ZERO VOLUME IMBALANCE STRIP cBot Fair Value Gap Key Levels, image 4
Trading product for MACRO_ZERO VOLUME IMBALANCE STRIP cBot Fair Value Gap Key Levels, image 5
Trading product for MACRO_ZERO VOLUME IMBALANCE STRIP cBot Fair Value Gap Key Levels, image 6
11.46M
Traded volume
168.21K
Pips won
2
Sales

Description

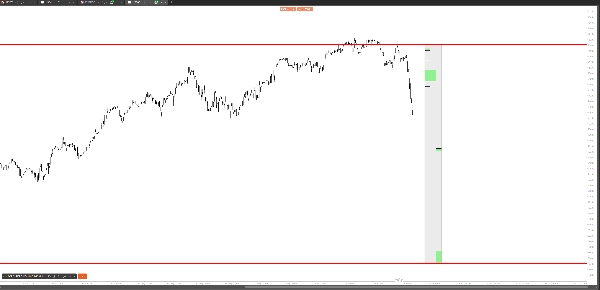
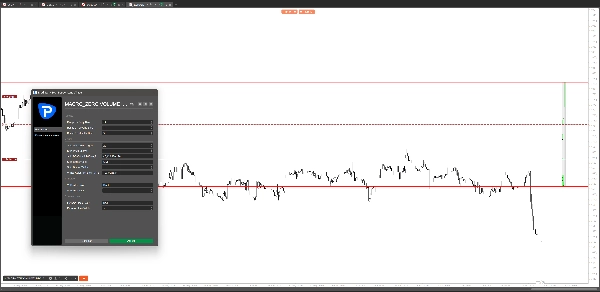
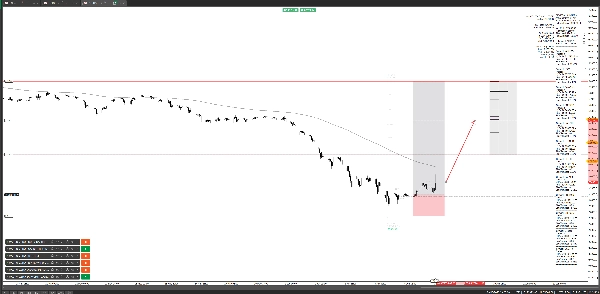
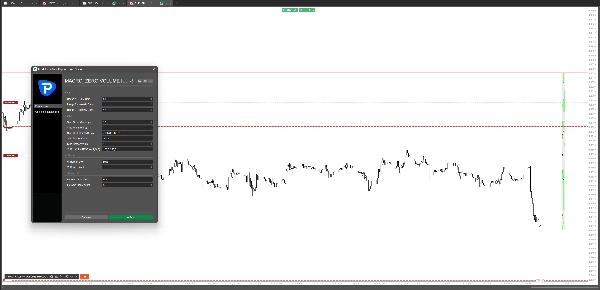
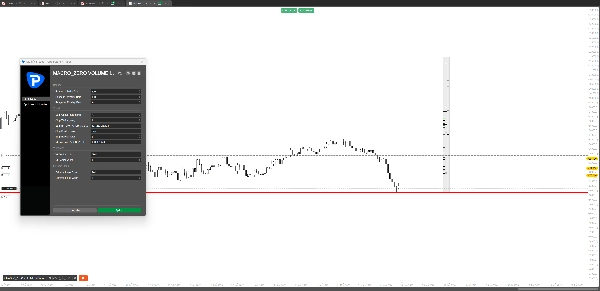
WHAT IT DOES Draws three side-by-side vertical strips directly on your chart, each representing volume imbalance zones detected across Daily, Weekly, and Monthly timeframes simultaneously. All three strips share the same global high and low — the highest top and lowest bottom across all detected imbalances — giving you an immediate visual reference of the full imbalance range in play. Two red horizontal lines mark the absolute highest and lowest imbalance levels across all three timeframes and all selected bar ranges — these are your key macro levels. Price has a natural tendency to revisit these extremes, making them powerful reference points for targets, stop placement, and trend context. TRADE WITH THE IMBALANCE Volume imbalance zones — also known as fair value gaps — are price areas where the market moved aggressively without two-sided participation. These inefficiencies act as magnets. Price consistently returns to fill or react at these levels, making each zone a high-probability area for: — Support and resistance reactions — Precision entry points on pullbacks — Profit targets on continuation moves — Confluence zones when aligned across timeframes When a Daily, Weekly, and Monthly imbalance stack at the same price level, that confluence becomes one of the strongest areas on your chart. The strip panel makes this alignment instantly visible — no manual analysis required. THREE-STRIP PANEL Each strip corresponds to one timeframe — Daily on the left, Weekly in the center, Monthly on the right. Strips are rendered to the right of the last bar at a configurable offset, sitting flush against each other with individual borders so each timeframe is clearly separated. The background spans the full global range; imbalance boxes are drawn at their exact price levels inside each strip. Risk Disclaimer: Trading financial instruments involves substantial risk of loss. Volume imbalance zones are analytical references only and do not guarantee price reaction. This tool does not constitute financial advice. Always apply proper risk management. ⚠️ Risk Warning: Past price behavior at imbalance zones is not indicative of future results. Trade responsibly and only with capital you can afford to lose.

Summary

AI summary
MACRO_ZERO VOLUME IMBALANCE STRIP is a multi-timeframe volume imbalance visualization tool designed for cTrader. It displays three vertical strips side-by-side on the chart, each representing volume imbalance zones—also known as fair value gaps—detected on Daily, Weekly, and Monthly timeframes. These strips share a common global high and low, highlighting the full range of imbalances across all timeframes. Two red horizontal lines mark the absolute highest and lowest imbalance levels, serving as key macro reference points.
Volume imbalance zones indicate price areas where market moves occurred with limited two-sided participation, often acting as magnets where price tends to revisit. This tool helps identify high-probability areas for support and resistance reactions, precision entries on pullbacks, profit targets on continuation moves, and confluence zones when imbalances align across multiple timeframes.
The three-strip panel is positioned to the right of the last bar with configurable offset and clear borders separating each timeframe. The background spans the full global imbalance range, with imbalance boxes drawn at exact price levels within each strip. This visualization aids traders in quickly assessing macro-level volume imbalances without manual analysis.
Trading profile

Customer reviews

5.0
Reviews: 1
5
100 %
4
0 %
3
0 %
2
0 %
1
0 %
Customer reviews
July 2, 2026
An innovative visualization tool for ICT and SMC traders that compresses Daily, Weekly, and Monthly volume imbalance analysis into a compact three-strip panel. The indicator excels at identifying multi-timeframe confluence zones while keeping the chart clean and readable. Best suited for experienced discretionary traders working with market structure and fair value gap concepts.

Discussion

FAQ

Fair Value Gap
Key Levels
Imbalance
Volume
Support & Resistance
Products available through cTrader Store, including trading bots, indicators and plugins, are provided by third-party developers and made available for informational and technical access purposes only. cTrader Store is not a broker and does not provide investment advice, personal recommendations or any guarantee of future performance.

More from this author

cBot
ADX
ATR
+5
Analyze quarterly cycles and weekly seasonality patterns across multiple instruments with historical bias data
cBot
Forex
BTCUSD
+5
HTF candles (1H, 4H, 8H, 12H, 16H, 1D, 20D, 1W, 1M) Charts (15M-Daily).
cBot
SMC
Forex
+5
Advanced volatility calculator with OB/BB Block detection and real-time alert system for analysis
Indicator
ATR
Breaker Block
+5
Display your symbol, timeframe or custom text as a watermark on any chart position with full color and size control.
cBot
Key Levels
SL Manager
+4
Multi-symbol dashboard with 3 fixed charts, dynamic position slots ranked by profit, Ratio analysis, MZ phase detection
cBot
Key Levels
SL Manager
+4
RISK REWARD VISUALIZER Part of the MACRO ZERO Suite Visualize your active positions, pending orders, and cl
cBot
SMC
Forex
+5
Multi-timeframe OHLC bars + projection levels from session analysis. Alerts on key level crosses. No trading execution.

You may also like

cBot
Perfectly optimized to trade GBPUSD. Win rate is over 85%
cBot
Forex
Crypto
+6
Allows you to speed up chart annotation by letting you create drawing tools via Hot Keys.
cBot
Forex
BTCUSD
+11
CandlePatternBot — Trade classic candlestick signals with bull/bear bias and SL/TP or next-pattern exits.
cBot
AI
SMC
+18
✨ Get ready to rediscover trading through a lens of geometric elegance.📈
cBot
Grid
XAUUSD
+2
🔥 Grid Classic – A Simple Yet Powerful Grid System
cBot
Prop
Forex
+11
Risk On Trade Lite | Auto Position Size Calculator for cTrader | Risk & Reward Tool | Auto Lot Size Calculator
cBot
Aggressive
Break Even
+1
This is a 2nd Version of "MycBots" swing trading + scalping strategy for XAUUSD and other Symbols.
37%
ROI
1.85
Profit factor
cBot
Fixed Risk %
Risk/Reward
+5
One-click fixed-risk execution with a built-in daily loss guard. Made for manual traders and prop challenges.
0.01
Profit factor
cBot
AI
Scalp you rich!
cBot
ATR
SL Manager
+3
Este cBot está diseñado para operar rupturas de rango en BTCUSD con una logica simple
49.6%
ROI
1.44
Profit factor
cBot
Key Levels
Spread Filter
+3
MATRIX INFINITY, See Beyond the Market.
22.3%
ROI
31
Profit factor
cBot
AI
Forex
+4
A Trend Master AI, Suitable for more advance pro trader with fully customisation and risk control PLEASE ENJOY!!
10.9%
ROI
4
Profit factor
cBot
AI
Forex
+4
Trend Following Strategy with adjustment Risk Management PLEASE ENJOY!!
10.9%
ROI
3.2
Profit factor
cBot
ATR
RSI
+5
Professional Multi-Strategy Grid Trading Bot
cBot
ATR
Forex
+4
Automate SL & Trailing for manual trades. Independent Buy/Sell logic. Chandelier Exit & ATR support.
cBot
Versatile Adaptive System, for Scalper, Long trader, HFT
cBot
ATR
EMA
+5
Smart Trading Bot with Rich Management Tools for FOREX PAIRS, NASDAQ, GOLD, OIL
14.4%
ROI
1.38
Profit factor
cBot
Forex
BTCUSD
+7
Fully functional demo runs until January 31, 2026 with over 100% ROI within 14 days

Price

11.46M
Traded volume
168.21K
Pips won
2
Sales