Descrição
MTC Akademika Harmonics
Estrutura harmônica do mercado, vista através da lente da *Monadologia* de Leibniz — na interpretação pessoal de David Murawski, der Mustermann.
Descrição Curta
MTC Akademika Harmonics é uma sobreposição de gráfico construída sobre uma única convicção: o preço não é ruído, mas um plenum de reflexos. Fundado nos princípios da *Monadologia* de Gottfried Wilhelm Leibniz — na interpretação pessoal de anos de David Murawski, der Mustermann — revela onde a estrutura harmônica do mercado entra em acordo em todas as escalas, e condensa essa leitura em um painel calmo e profissional. É uma ferramenta de análise e visualização discricionária, não um sistema automatizado ou serviço de sinais.
A Ideia
Em 1714, Leibniz propôs que a realidade é composta por unidades simples e indivisíveis — *mônadas* — cada uma das quais reflete o universo inteiro de seu próprio ponto de vista, e que a ordem que experimentamos surge de uma *harmonia pré-estabelecida* entre elas. Nada, ele sustentava, existe sem sua *razão suficiente*.
Este indicador aplica essa visão de mundo ao gráfico. Cada estrutura, desde o menor movimento até o maior, é tratada como um reflexo de um mesmo todo — a parte contida no todo, o todo ecoado na parte. O significado não é reivindicado a partir de qualquer sinal isolado; ele emerge nos momentos em que reflexos independentes entram em harmonia. E nenhum ponto de virada é arbitrário — cada um carrega sua razão na estrutura que o produziu.
Não é um scanner genérico de padrões. É a destilação de um autor de uma ideia com trezentos anos de idade em um instrumento que observa por você.
O Que Você Recebe:
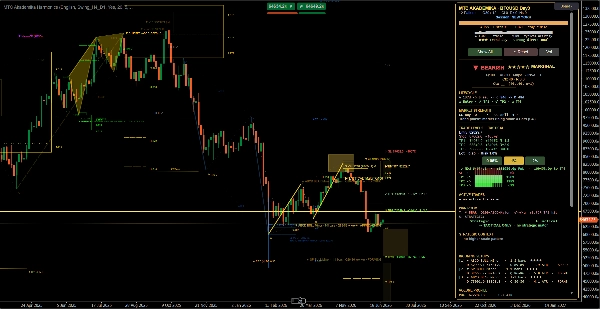
- **Uma leitura coerente em todas as escalas** — o menor movimento e o maior movimento em um único gráfico, para que você veja estrutura em vez de confusão.
- **Momentos de harmonia, marcados para você** — as raras situações em que reflexos independentes se alinham são destacadas, para que o contexto mais forte se destaque por si só.
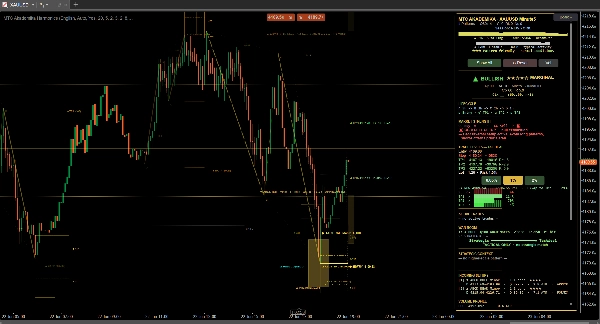
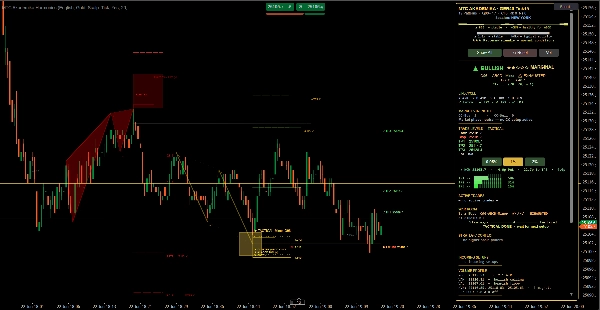
- **Configurações completas e legíveis** — para cada estrutura: uma zona clara, alvos projetados e um stop protetor, com a relação recompensa-risco mostrada de relance.
- **Um painel de comando profissional (War Room / UI Moderna)** — direção, convicção, contexto de mercado e a imagem multi-temporal, condensados em um painel.
- **Ciclo de vida de relance** — cada estrutura é marcada como *ativa*, *gasta* ou *inválida*, para que você sempre saiba o que ainda merece sua atenção e o que ignorar.
- **Uma visão de risco integrada** — tamanho da posição a partir do tamanho da sua conta e risco por operação, mostrado na moeda da sua conta.
- **Consciência e alertas multi-temporais** — uma leitura de timeframe superior, além de alertas opcionais para novas estruturas e toques-chave.
- **Um tutorial guiado em sete idiomas** — ensina a filosofia e o painel enquanto você os usa.
Para Quem É
Traders discricionários que pensam em estrutura em vez de indicadores; que querem uma imagem calma e unificada em vez de uma parede de alertas; e que apreciam que os melhores instrumentos escondem sua mecânica e mostram apenas o que importa.
Sobre o Método
Como a harmonia é medida, como as escalas se relacionam, como a leitura é formada — estes são frutos de longa pesquisa privada e, por design, não são divulgados. Você está adquirindo o julgamento, não a receita.
Compatibilidade
Funciona como uma sobreposição de gráfico em **qualquer símbolo e qualquer timeframe** (incluindo gráficos de ticks). Interface em inglês, alemão, espanhol, italiano, francês, russo e português.
Risco
MTC Akademika Harmonics é uma ferramenta de análise e visualização discricionária, não um sistema de negociação automatizado ou serviço de sinais. Ele destaca estrutura e contexto; a decisão de negociar e a gestão do risco permanecem inteiramente suas. Negociar envolve risco de perda. Resultados passados não garantem resultados futuros.