

Descrizione
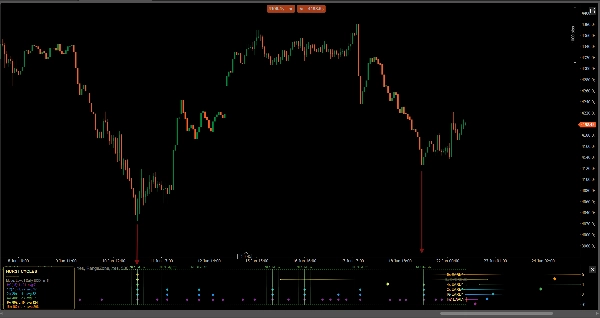
MTC Hurst Cycle Akademica mappa la struttura ciclica di qualsiasi mercato, livello per livello, in un sotto-pannello dedicato. Basato sul modello ciclico di mercato di J. M. Hurst, segna i punti di minimo confermati del ciclo (e opzionalmente i massimi) di ogni livello di ciclo abilitato come diamanti codificati a colori, proietta il timing del prossimo minimo ciclico previsto e evidenzia il "Nido di Minimi" — barre in cui si prevede che coincidano diversi minimi ciclici, il classico contesto di inversione ad alta probabilità di Hurst.
CARATTERISTICHE PRINCIPALI
• 7 livelli di ciclo annidati (HC, 1C, 2x, 4x, 8x, 16x, 32x) — abilita qualsiasi combinazione.
• Diamanti solo confermati — i marcatori più recenti NON si ridisegnano sulla barra in tempo reale.
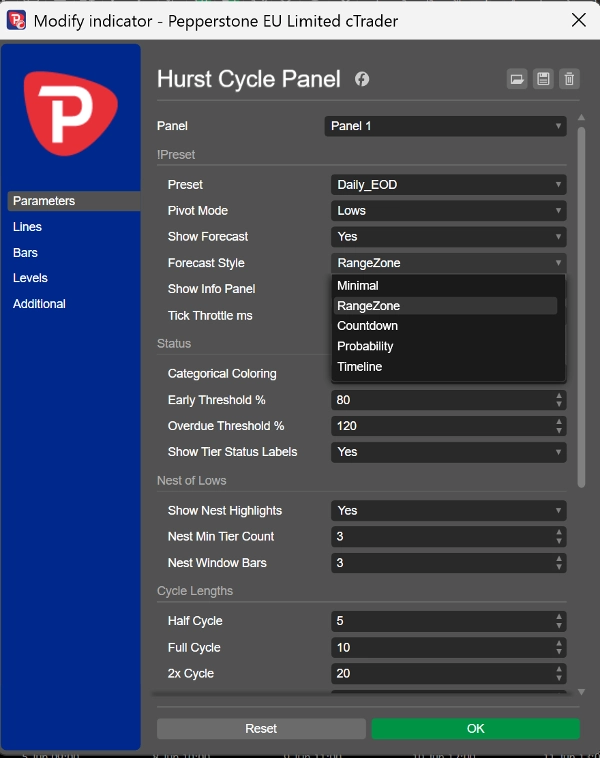
• Previsione del prossimo minimo in 5 stili di visualizzazione: Minimal, Range Zone, Countdown, Probability (1σ / 2σ), Timeline.
• Evidenziazione del "Nido di Minimi", scalata automaticamente alle lunghezze di ciclo abilitate.
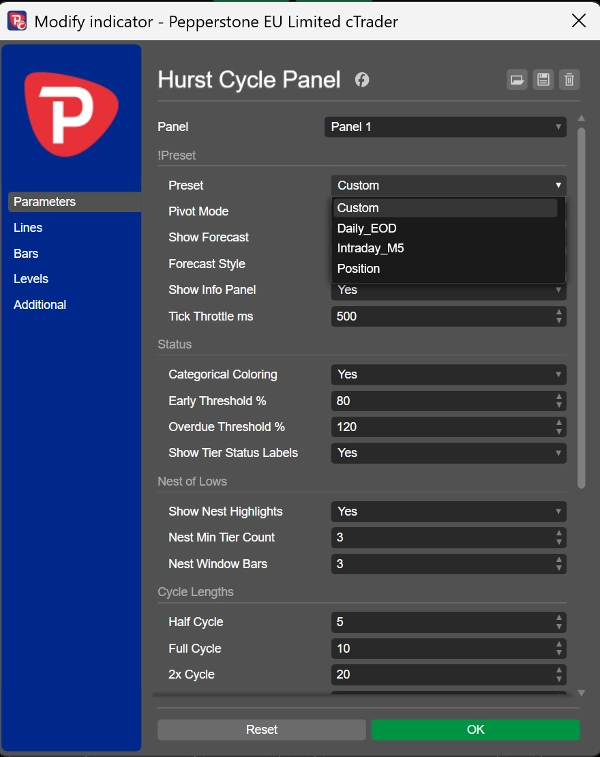
• Preimpostazioni con un clic: Daily EOD, Intraday M5, Position — o lunghezze di ciclo completamente personalizzate.
• Pannello informativo moderno sul grafico: conteggi pivot per livello, lunghezza media del ciclo misurata (mostrata solo quando statisticamente significativa) e controllo del rapporto armonico.
• Modalità pivot: Minimi, Massimi o Entrambi.
• Scala ad adattamento automatico, rendering pulito e senza sfarfallio.
COME UTILIZZARLO
Aggiungilo sotto il tuo grafico dei prezzi. Leggi i diamanti più bassi e l'evidenziazione del "Nido" come la spina dorsale del timing ciclico del mercato e usa la previsione per anticipare la finestra temporale della prossima inversione. Si abbina naturalmente a MTC Hurst FLD Akademica (livelli di prezzo) e MTC Hurst Pulse Akademica (oscillatore di maturità ciclica).
FUNZIONA SU
Qualsiasi simbolo e qualsiasi timeframe.
DICHIARAZIONE DI RESPONSABILITÀ
Questo è uno strumento di analisi tecnica e visualizzazione basato sulla teoria ciclica di mercato di J. M. Hurst. Non effettua ordini e non garantisce prestazioni, accuratezza o profitti. L'analisi ciclica è probabilistica e le proiezioni future sono stime, non previsioni. Applica sempre la tua gestione del rischio e il tuo giudizio. Il comportamento passato del mercato non garantisce risultati futuri.
Riepilogo
Key features include seven nested cycle tiers (HC, 1C, 2x, 4x, 8x, 16x, 32x) with customizable combinations, one-click presets for common timeframes (Daily EOD, Intraday M5, Position), and a modern on-chart info panel showing pivot counts, average cycle length, and harmonic-ratio checks. Users can select pivot modes (Lows, Highs, or Both) and benefit from auto-fitting scale and flicker-free rendering.
The panel works on any symbol and timeframe and is intended as a visualization tool to aid cycle timing analysis. It complements other Hurst-based tools for price levels and cycle maturity oscillation.












![Logo di "[Stellar Strategies] VBO"](https://cdn.ctrader.com/image/webp/f034c012-94d4-445a-a01b-febd1cdedaef_36944)







