Deskripsi
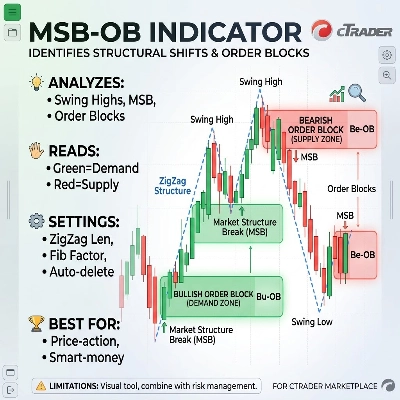
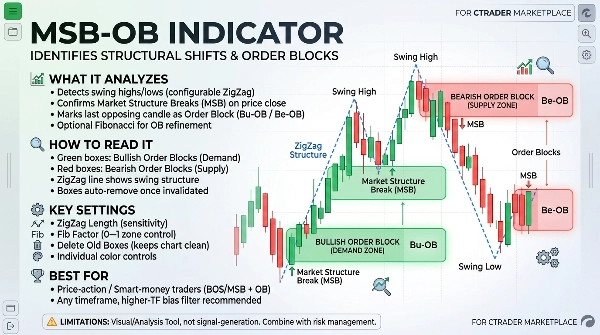
MSB-OB Indicator identifies structural shifts in price action and highlights the Order Blocks (OB) responsible for those shifts.
WHAT IT ANALYZES
- Detects swing highs/lows using a configurable ZigZag length
- Confirms Market Structure Breaks (MSB) when price closes beyond the last relevant pivot
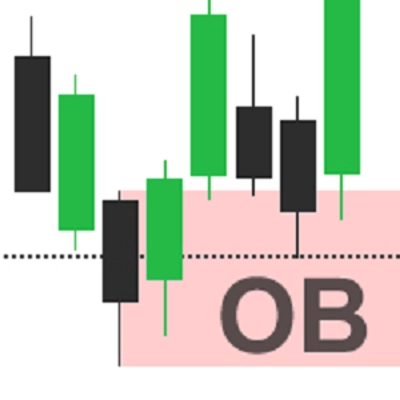
- Marks the last opposing candle before the break as an Order Block (Bu-OB for bullish, Be-OB for bearish)
- Optional Fibonacci factor to refine the OB zone instead of using the full candle range
HOW TO READ IT
- Green boxes = bullish Order Blocks (potential demand zones)
- Red boxes = bearish Order Blocks (potential supply zones)
- ZigZag line (optional) shows the swing structure used for detection
- Boxes extend forward and auto-remove once invalidated (configurable)
KEY SETTINGS
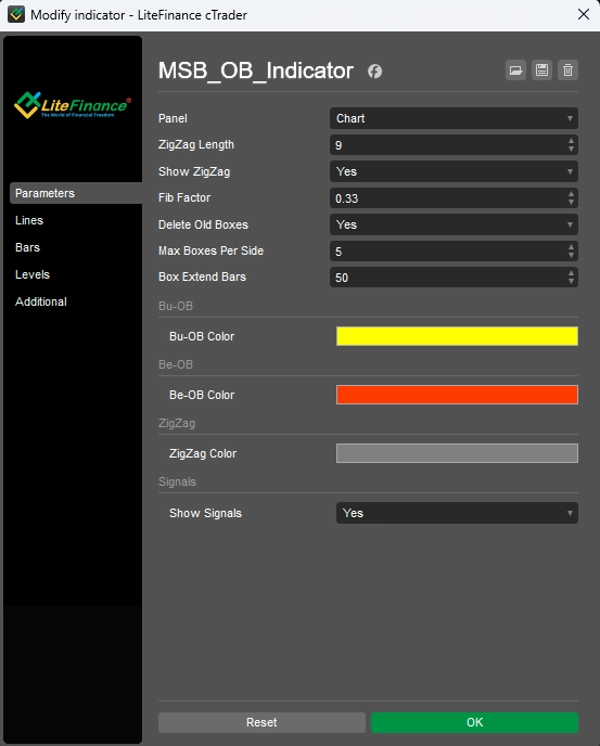
- ZigZag Length: sensitivity of swing detection (lower = more signals, higher = major structure only)
- Fib Factor: 0–1, controls how much of the candle range is used for the OB zone
- Delete Old Boxes: keeps the chart clean by removing invalidated/old zones
- Individual color controls for each box type
BEST FOR
Traders using price-action / smart-money-style structure analysis (BOS/MSB + OB) on any timeframe, best combined with a higher-timeframe bias filter.
LIMITATIONS
This is a visual/analysis tool, not a signal-generation system on its own. Always combine with your own risk management and trade plan.