


คำอธิบาย
สิ่งที่มันทำ
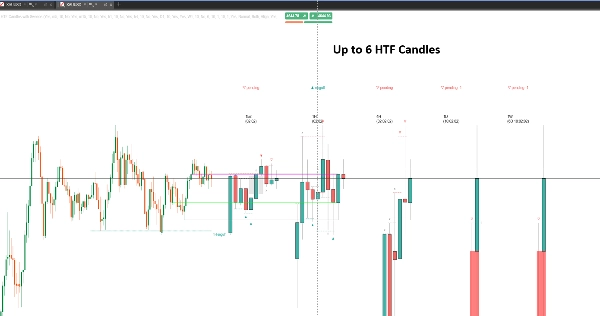
HTF Candles with Sweeps วาดแท่งเทียนจากกรอบเวลาที่สูงกว่าถึงหกกรอบเวลาเป็นแท่งเทียนจริงข้างๆ กราฟของคุณ — 5 นาที, 15 นาที, 1 ชั่วโมง, 4 ชั่วโมง, รายวัน, รายสัปดาห์ หรือความละเอียดใดๆ ที่คุณเลือก — เพื่อให้เรื่องราวของกรอบเวลาที่สูงกว่านั่งอยู่ข้างราคาที่คุณกำลังเทรด แทนที่จะต้องสลับกราฟไปมา
เหนือแท่งเทียนเหล่านั้น มันตรวจจับการสวิงของสภาพคล่อง: แท่งเทียนที่เทรดผ่านจุดสูงหรือต่ำที่อยู่เบื้องหลังเพื่อรับคำสั่งที่รออยู่ เครื่องมือส่วนใหญ่จะหยุดแค่การแจ้งเตือนการสวิงนี้ ตัวนี้ติดตามสิ่งที่เกิดขึ้นต่อไป เพราะการสวิงที่ถูกเรียกคืนและการสวิงที่กลายเป็นการเบรกเอาต์มีความหมายตรงกันข้าม
แผงกรอบเวลาที่สูงกว่า
ช่องว่างอิสระหกช่อง แต่ละช่องมีกรอบเวลา จำนวนแท่งเทียน และสีของตัวเอง ชุดแต่ละชุดวาดด้วยตัวแท่งเทียนและไส้เทียนที่ถูกต้อง มีการนับถอยหลังสดไปยังการปิดถัดไป และป้ายกรอบเวลาอยู่ด้านบนและด้านล่าง
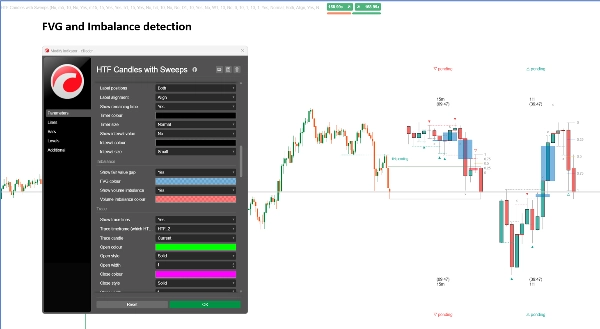
ระหว่างแท่งเทียนที่วาด แผงยังทำเครื่องหมาย ช่องว่างมูลค่ายุติธรรม และ ความไม่สมดุลของปริมาณ — ความไม่สมดุลเดียวกันที่คุณจะอ่านได้บนกราฟกรอบเวลาที่สูงกว่าโดยไม่ต้องเปิดมัน
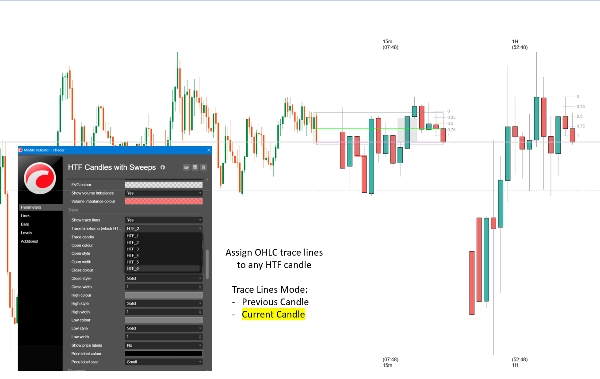
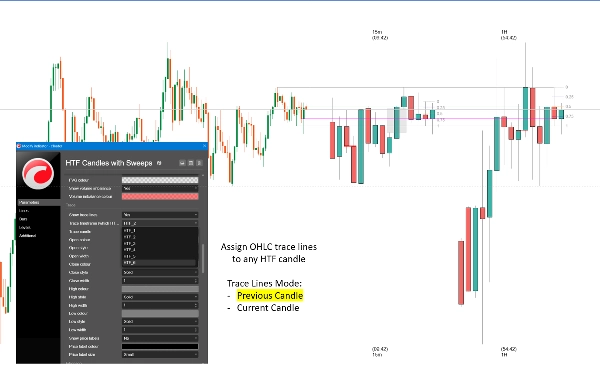
เส้นติดตาม เชื่อมต่อการเปิด สูง ต่ำ และปิดของกรอบเวลาที่เลือกกลับไปยังแท่งเทียนที่แน่นอนบนกราฟของคุณที่แต่ละค่าแสดงผล เพื่อให้คุณเห็นว่าระดับนั้นมาจากที่ไหน เลือกแท่งเทียนที่กำลังก่อตัวหรือแท่งเทียนที่เสร็จสมบูรณ์ล่าสุด
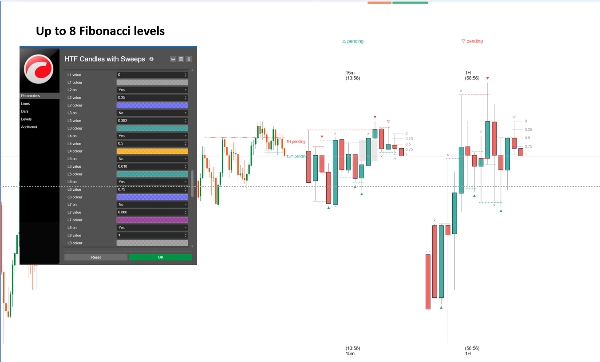
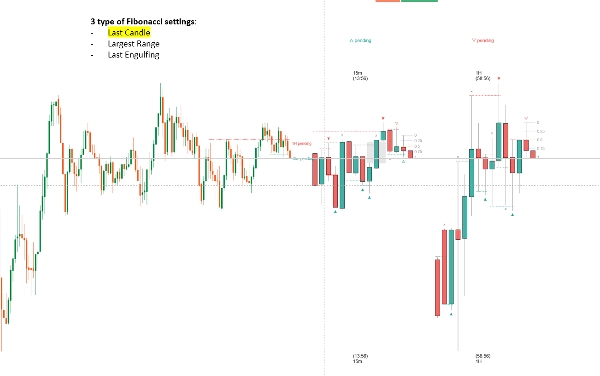
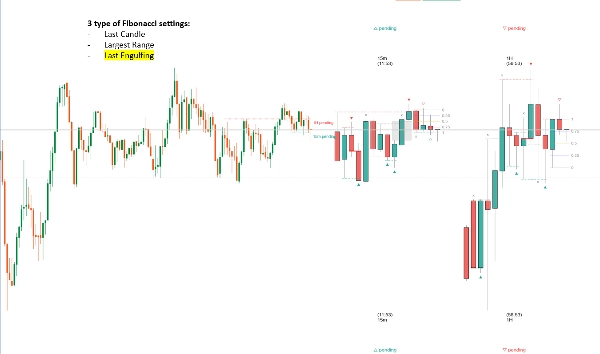
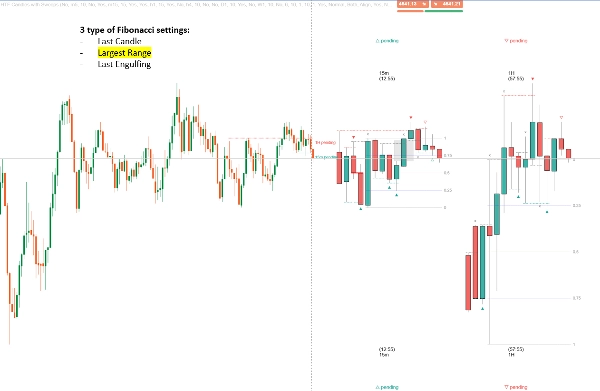
ระดับฟีโบนักชี ฉายจากแท่งเทียนกรอบเวลาที่สูงกว่าพร้อมแปดระดับที่ปรับแต่งได้และสมาร์ทแองเคอร์ที่เลือกแท่งเทียนให้คุณ: แท่งเทียนที่เสร็จสมบูรณ์ล่าสุด แท่งเทียนที่มีความกว้างสูงสุดจากสูงถึงต่ำในมุมมอง หรือแท่งเทียนที่กลืนกินล่าสุด
การตรวจจับการสวิงของสภาพคล่อง
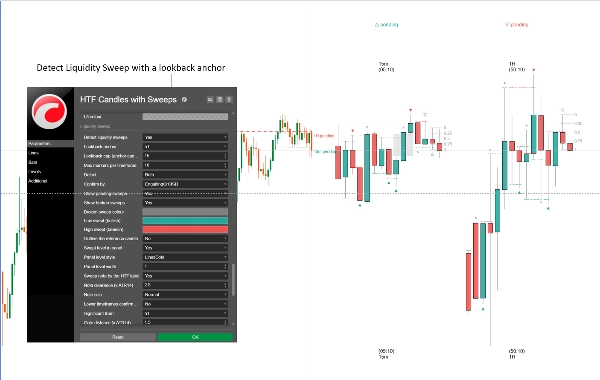
สำหรับแท่งเทียนกรอบเวลาที่สูงกว่าที่เสร็จสมบูรณ์แต่ละแท่ง เครื่องยนต์จะย้อนกลับไปและหาจุดสูงสุดสูงสุด — หรือจุดต่ำสุดต่ำสุด — ที่แท่งเทียนนั้นผ่านจริงๆ หยุดที่แท่งเทียนแรกที่ไม่สามารถผ่านได้ ระดับนั้นคือสิ่งที่การสวิงเอาไป
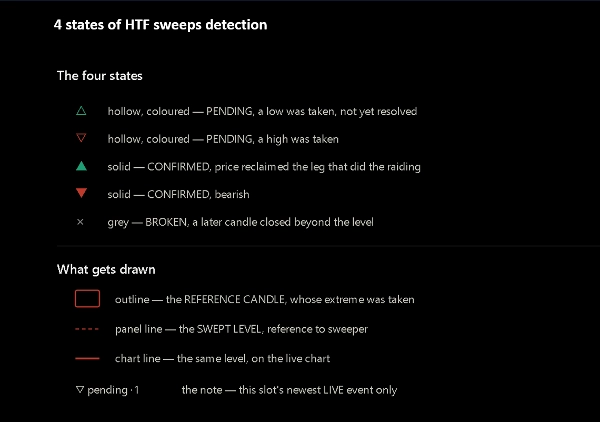
การสวิงนั้นจะถูกติดตามผ่านสี่สถานะ:
— รอดำเนินการ — ระดับถูกเอาไป ยังไม่มีอะไรแก้ไขมัน
— ยืนยันโดย CISD — ราคาปิดกลับผ่านการเปิดของการวิ่งที่สร้างจุดสุดขีด
— ยืนยันโดยการกลืนกิน — ตัวแท่งเทียนภายหลังมีตัวแท่งเทียนที่กลืนกินแท่งเทียนสวิงและปิดตรงกันข้าม
— แตกหัก — แท่งเทียนภายหลังปิดเลยระดับนั้นไป ดังนั้นมันคือการเบรกเอาต์ ไม่ใช่การสวิง
แต่ละสถานะมีเครื่องหมายของตัวเอง ดังนั้นแท่งเทียนที่สวิงอะไรบางอย่างจะแสดงมันเสมอ และเครื่องหมายบอกคุณว่ามันจบอย่างไร ไม่มีการวาดซ้ำ: มีการตัดสินเฉพาะแท่งเทียนที่เสร็จสมบูรณ์ และการเปลี่ยนสถานะแต่ละครั้งตัดสินใจเมื่อปิดแท่งเทียน
การรวมกันข้ามกรอบเวลา
หน้าต่างย้อนกลับหนึ่งหน้าต่างแสดงเป็นแท่งเทียนของกรอบเวลาแองเคอร์และแปลงเป็นจำนวนแท่งเทียนของแต่ละช่อง ดังนั้นการสวิง 15 นาทีและการสวิงรายชั่วโมงจะถูกวัดในช่วงตลาดเดียวกัน เมื่อหลายกรอบเวลาตกลงกัน พวกมันกำลังอธิบายเหตุการณ์เดียวกันจริงๆ
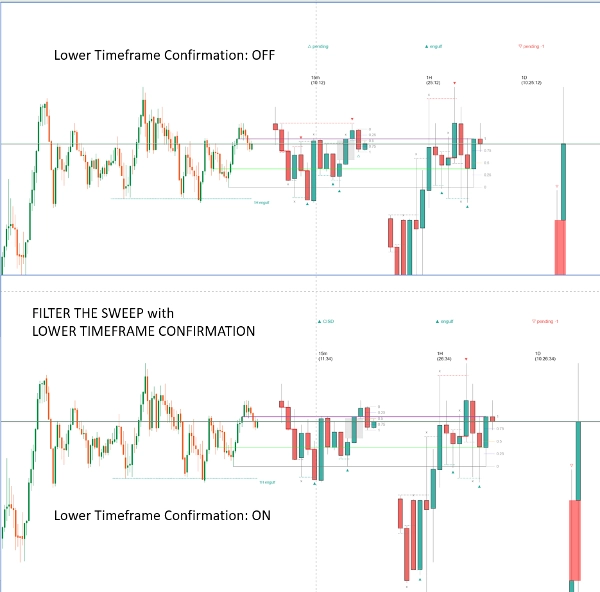
เกตตัวเลือกเสริมทำให้เรื่องนี้ก้าวไปไกลขึ้น: กรอบเวลาที่ต่ำกว่าการแบ่งที่คุณเลือกจะรายงานการสวิงก็ต่อเมื่อกรอบเวลาที่สูงกว่ามีการสวิงอยู่แล้วในทิศทางเดียวกันที่ราคาที่เปรียบเทียบได้ กรอบเวลาที่ต่ำกว่าจะหยุดรายงานเสียงรบกวนในช่วงและเริ่มยืนยันการเคลื่อนไหวที่ใหญ่กว่า
ระดับที่ถูกสวิงบนกราฟของคุณ
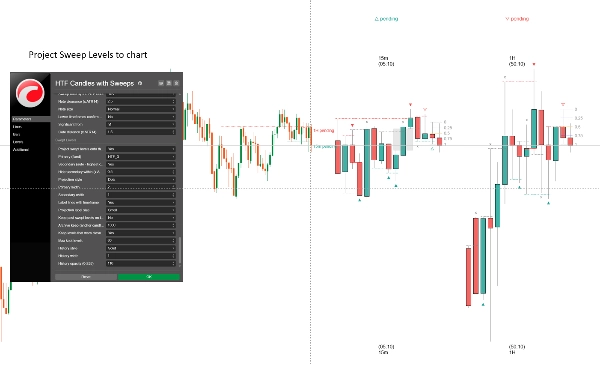
แผงแสดงแท่งเทียน; กราฟแสดงราคา ระดับที่ถูกสวิงจะวาดเป็นเส้นแนวนอนที่ลากจากจุดที่แท่งเทียนอ้างอิงก่อตัวจริงๆ ไปจนถึงปัจจุบัน — มีป้ายชื่อกรอบเวลาและสถานะปัจจุบัน เส้นหลักมาจากกรอบเวลาที่คุณกำหนด; เส้นรองเติมอัตโนมัติด้วยกรอบเวลาสูงสุดอื่นที่ถูกสวิงในขณะนั้น
อาร์ไคฟตัวเลือกเสริมเก็บระดับที่ถูกสวิงในอดีตบนกราฟหลังจากแท่งเทียนนั้นเลื่อนออกจากแผง เพื่อให้คุณสามารถย้อนดูว่าการตรวจจับทำงานอย่างไรตลอดช่วงเซสชัน
การใช้งานทั่วไป
เทรดจากกราฟ 5 นาทีหรือ 15 นาทีในขณะที่แท่งเทียนรายชั่วโมงและ 4 ชั่วโมงนั่งข้างๆ เมื่อกรอบเวลาที่สูงกว่าสวิงระดับและยืนยัน คุณจะมีทิศทางและราคาที่จะทำงานด้วย เมื่อกรอบเวลาที่ต่ำกว่าตกลงกัน คุณจะมีการรวมกัน เมื่อระดับแตกแทน เครื่องหมายก็จะบอกคุณเช่นกัน และคุณจะหยุดรอการกลับตัวที่ไม่มา
มันเหมาะกับการเทรดสไตล์สวิงสภาพคล่องและสมาร์ทมันนี่ งานเบรกเอาต์ที่ล้มเหลว และวิธีการใดๆ ที่สร้างขึ้นรอบจุดสูงและต่ำก่อนหน้า ใช้ได้กับฟอเร็กซ์ ดัชนี โลหะ และคริปโต
การตั้งค่า
— ช่องกรอบเวลาหกช่อง แต่ละช่องมีความละเอียด จำนวนแท่งเทียน สวิตช์ฟีโบนักชี และการจัดแต่งเต็มรูปแบบ
— การจัดวางแผง: ระยะห่างจากราคา ความกว้างแท่งเทียน ช่องว่างระหว่างแท่งเทียนและระหว่างกรอบเวลา
— ป้ายชื่อ: ชื่อกรอบเวลาด้านบนและล่าง ตัวจับเวลานับถอยหลัง ค่าอินเทอร์วัล ขนาด และสี
— ความไม่สมดุล: ช่องว่างมูลค่ายุติธรรมและความไม่สมดุลของปริมาณ สีปรับได้
— เส้นติดตาม: ช่องไหน แท่งเทียนปัจจุบันหรือก่อนหน้า สีเส้น สไตล์ ความกว้าง และป้ายราคาต่อเส้น
— ฟีโบนักชี: แปดระดับพร้อมค่ารายบุคคล สี และสวิตช์ รวมถึงสามโหมดสมาร์ทแองเคอร์
— การตรวจจับการสวิง: แองเคอร์ย้อนกลับและขีดจำกัด ทิศทาง เส้นทางการยืนยัน ขีดจำกัดเครื่องหมายต่อกรอบเวลา
— ลักษณะเครื่องหมายสำหรับสถานะรอดำเนินการ ยืนยัน และแตกหัก
— เกตการรวมกัน: แบ่งกรอบเวลาและความทนทานระยะทาง
— การฉายกราฟ: ช่องหลัก ช่องรองอัตโนมัติ สไตล์ และป้ายชื่อ
— อาร์ไคฟ: การเก็บรักษาในแท่งเทียนแองเคอร์ จำนวนสูงสุดที่เก็บไว้ การจัดแต่ง
เหมาะสำหรับใคร
เทรดเดอร์รายวันและสวิงที่ทำงานกับจุดสูงและต่ำของกรอบเวลาที่สูงกว่าอยู่แล้วและต้องการให้เห็นโดยไม่ต้องสลับกราฟ มันสมมติว่าคุณรู้ว่าการสวิงสภาพคล่องคืออะไรและทำไมการเรียกคืนจึงสำคัญ หากการสวิงยังไม่ใช่ส่วนหนึ่งของวิธีที่คุณอ่านกราฟ ตัวนี้จะไม่สอนให้คุณเทรดมัน
สิ่งที่มันไม่ทำ
การชี้แจงเรื่องนี้ตอนนี้ช่วยประหยัดเวลาของเราทั้งคู่ในภายหลัง:
— มันไม่ให้สัญญาณซื้อหรือขาย และไม่มีราคาการเข้าออก หยุด หรือเป้าหมาย
— มันไม่วางคำสั่งและไม่สามารถเข้าถึงบัญชีของคุณได้ — ตัวบ่งชี้ทำงานโดยไม่มีสิทธิ์เข้าถึงใดๆ
— มันไม่มีการแจ้งเตือนหรือการแจ้งข่าวสาร
— มันไม่ทำนายอะไร เครื่องหมายแต่ละอันอธิบายแท่งเทียนที่ปิดไปแล้ว
— มันไม่วาดซ้ำ มีการตัดสินเฉพาะแท่งเทียนที่เสร็จสมบูรณ์ ดังนั้นเครื่องหมายจะไม่เปลี่ยนแปลงหลังจากนั้น
— มันไม่ใช่กลยุทธ์ การสวิงที่ได้รับการยืนยันอธิบายสิ่งที่ราคาทำ ไม่ใช่สิ่งที่คุณควรทำกับมัน
สิ่งที่ควรรู้
การตรวจจับอ่านแท่งเทียนที่แต่ละช่องวาดจริง ดังนั้นการสวิงจึงมีแท่งเทียนบนหน้าจอเพื่อทำเครื่องหมายเสมอ
การเพิ่มจำนวนแท่งเทียนของช่องจะขยายระยะเวลาย้อนกลับที่มันสามารถดูได้
แท่งเทียนกรอบเวลาที่สูงกว่าจะเริ่มต้นที่เวลาของเซิร์ฟเวอร์โบรกเกอร์ของคุณ โบรกเกอร์สองรายบนเครื่องมือเดียวกันอาจตัดชั่วโมงหรือวันในจุดที่ต่างกัน ซึ่งหมายความว่าสัญลักษณ์เดียวกันอาจอ่านแตกต่างกันอย่างถูกต้องบนสองแพลตฟอร์ม นั่นเป็นคุณสมบัติของข้อมูล ไม่ใช่ข้อผิดพลาดของตัวบ่งชี้
การสวิงบนแท่งเทียนที่ปิดล่าสุดสามารถเป็นได้แค่สถานะรอดำเนินการ — การยืนยันต้องการแท่งเทียนภายหลังปิด บนช่องรายวันนั่นหมายถึงการรอหนึ่งวัน
การเทรดมีความเสี่ยง ผลการดำเนินงานในอดีตไม่รับประกันผลลัพธ์ในอนาคต
สรุป
The indicator detects liquidity sweeps—candles that trade through previous highs or lows to capture resting orders—and tracks their resolution through four states: pending, confirmed by close inside the sweep’s range, confirmed by engulfing candle, or broken (breakout). These states are visually marked and only finalized on completed candles, ensuring no repainting.
Additional features include marking fair value gaps and volume imbalances between candles, trace lines linking higher timeframe candle levels to your chart, and configurable Fibonacci levels projected from selected higher timeframe candles with smart anchoring options.
Cross-timeframe confluence is supported by aligning sweep detection across multiple timeframes, with an optional gate to filter lower timeframe sweeps that confirm higher timeframe moves. Swept levels are drawn as horizontal lines on your chart with labels indicating timeframe and state, with an optional archive to retain past levels.
Designed for intraday and swing traders familiar with liquidity sweeps and higher timeframe analysis, it supports markets including forex, indices, metals, and crypto. The indicator does not provide trade signals, alerts, or order execution and operates solely as a visual analysis tool based on completed price data.
การสนทนา
รีวิวจากลูกค้า
คำถามที่พบบ่อย
เพิ่มเติมจากผู้เขียนคนนี้




















ราคา