
الوصف
مستويات الأرقام المستديرة - مؤشر لـ cTrader
الوصف
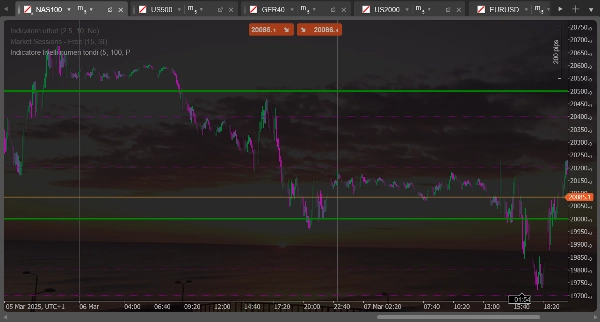
يرسم هذا المؤشر خطوطًا أفقية عند "الأرقام المستديرة" أو المستويات ذات الأهمية النفسية على الرسم البياني. إنه مثالي لتحديد مناطق الدعم والمقاومة المحتملة بناءً على مستويات السعر المستديرة التي غالبًا ما تحمل أهمية نفسية للمتداولين.
الميزات الرئيسية
- يرسم مجموعتين مميزتين من الخطوط الأفقية بفواصل منتظمة
- يحسب المستويات تلقائيًا بناءً على سعر الإغلاق الحالي
- يتحدث ديناميكيًا مع تحرك السعر
- يقدم إعدادات منفصلة لكل مجموعة من الخطوط (اللون، النمط، الحجم)
التعديلات الممكنة
للمجموعة الأولى من الخطوط (متقطعة)
- عدد خطوط المجموعة 1: يحدد عدد الخطوط التي تُرسم فوق وتحت السعر الحالي (الافتراضي: 5)
- حجم النطاق للمجموعة 1: يحدد المسافة بين الخطوط بوحدة النقاط (الافتراضي: 100 نقطة)
- لون خطوط المجموعة 1: يخصص لون الخطوط (الافتراضي: بنفسجي)
- سمك خطوط المجموعة 1: يحدد سمك الخطوط (الافتراضي: 1 بكسل)
للمجموعة الثانية من الخطوط (متصلة)
- عدد خطوط المجموعة 2: يحدد عدد الخطوط التي تُرسم فوق وتحت السعر الحالي (الافتراضي: 2)
- حجم النطاق للمجموعة 2: يحدد المسافة بين الخطوط بوحدة النقاط (الافتراضي: 500 نقطة)
- لون خطوط المجموعة 2: يخصص لون الخطوط (الافتراضي: أخضر)
- سمك خطوط المجموعة 2: يحدد سمك الخطوط (الافتراضي: 1 بكسل)
الاستخدام العملي
عادةً ما تُستخدم المجموعة الأولى (الخطوط المتقطعة) لتحديد المستويات النفسية الصغرى، بينما تبرز المجموعة الثانية (الخطوط المتصلة) المستويات النفسية الكبرى. على سبيل المثال، بالنسبة لـ EURUSD، قد تضبط المجموعة الأولى لعرض المستويات كل 100 نقطة (مثل 1.0800، 1.0900) والمجموعة الثانية للمستويات كل 500 نقطة (مثل 1.0500، 1.1000).
غالبًا ما تتزامن هذه المستويات مع مناطق دعم أو مقاومة حيث قد يرتد السعر أو يبطئ قبل متابعة حركته.
Round Number Levels - Indicator for cTrader
Description
This indicator draws horizontal lines at "round numbers" or psychologically significant levels on the chart. It's ideal for identifying potential support and resistance areas based on round price levels that often have psychological importance for traders.
Main Features
- Draws two distinct sets of horizontal lines at regular intervals
- Automatically calculates levels based on the current closing price
- Updates dynamically as price moves
- Offers separate configuration for each set of lines (color, style, size)
Possible Adjustments
For the first set of lines (dashed)
- Number of Lines Set 1: Determines how many lines to draw above and below the current price (default: 5)
- Range Size Set 1: Sets the distance between lines in pips (default: 100 pips)
- Line Color Set 1: Customizes the color of the lines (default: purple)
- Line Width Set 1: Sets the thickness of the lines (default: 1 pixel)
For the second set of lines (solid)
- Number of Lines Set 2: Determines how many lines to draw above and below the current price (default: 2)
- Range Size Set 2: Sets the distance between lines in pips (default: 500 pips)
- Line Color Set 2: Customizes the color of the lines (default: green)
- Line Width Set 2: Sets the thickness of the lines (default: 1 pixel)
Practical Usage
Typically, the first set (dashed lines) is used to identify minor psychological levels, while the second set (solid lines) highlights major psychological levels. For example, for EURUSD, you might set the first set to show levels every 100 pips (such as 1.0800, 1.0900) and the second set for levels every 500 pips (such as 1.0500, 1.1000).
These levels often coincide with support or resistance zones where price might bounce or slow down before continuing its movement.
الملخص
تقييمات العملاء
5 | 50 % | |
4 | 50 % | |
3 | 0 % | |
2 | 0 % | |
1 | 0 % |


