![Trading product for Trend Angle Indicator [Iridio Capital] Indikator Forex Crypto, image 1](https://cdn.ctrader.com/image/webp/28a98496-3412-4fea-82eb-be3347bdd6f1_27612)
![Trading product for Trend Angle Indicator [Iridio Capital] Indikator Forex Crypto, image 2](https://cdn.ctrader.com/image/webp/1831cdef-6a14-4f6e-9c0b-dfff3d168d29_27613)
Deskripsi
Ikhtisar
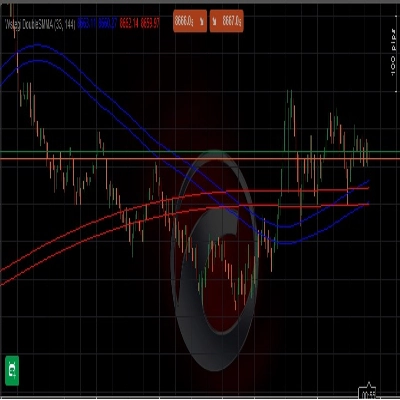
The Trend Angle Indicator memberikan cara yang jelas dan intuitif untuk memvisualisasikan tren pasar dengan menghitung kemiringan (dalam derajat) dari regresi linier garis selama sejumlah bar tertentu. Alih-alih mengandalkan indikator tren tradisional yang bisa sulit diinterpretasikan, alat ini menawarkan representasi sudut yang sederhana dari pergerakan harga, sehingga mudah untuk menilai kekuatan dan arah tren secara sekilas.
Cara Kerja
Regresi linier adalah metode statistik yang digunakan untuk memodelkan hubungan antara variabel—dalam hal ini, pergerakan harga dari waktu ke waktu. Metode ini menemukan garis terbaik yang meminimalkan deviasi dari nilai harga aktual, memungkinkan kita menentukan kemiringan tren. Dengan mengubah kemiringan ini menjadi derajat, indikator memberikan cara alami dan intuitif untuk menilai kondisi pasar:
- 0° → Pasar datar (tidak ada tren yang jelas)
- +25° hingga +60° → Tren naik (kemiringan lebih tinggi berarti tren lebih kuat)
- -25° hingga -60° → Tren turun (sudut negatif yang lebih curam menunjukkan penurunan yang lebih kuat)
Fitur & Kekuatan Utama
✅ Visualisasi Tren yang Intuitif – Alih-alih nilai sembarangan, indikator ini mengekspresikan tren dalam derajat, sehingga mudah dipahami seberapa curam pergerakan pasar.
✅ Mengidentifikasi Konsolidasi & Tren Kuat – Indikator ini menyoroti periode konsolidasi pasar (ketika sudut berada di antara garis horizontal hijau dan merah) dan tren bullish atau bearish yang kuat saat menembus di atas atau di bawah ambang ini.
✅ Penyorotan Warna untuk Kekuatan Tren – Area di atas +25° (tren naik kuat) dan di bawah -25° (tren turun kuat) diarsir, memungkinkan pengenalan cepat terhadap pergerakan kuat.
✅ Bekerja pada Semua Timeframe & Aset – Baik trading saham, forex, kripto, atau futures, alat ini membantu mendeteksi tren bermakna di berbagai pasar.
Cara Menggunakannya
- Perhatikan garis sudut tren:
-
- Jika tetap di antara +25° dan -25°, pasar sedang berkonsolidasi.
- Jika menembus di atas +25°, tren naik sedang menguat.
- Jika turun di bawah -25°, tren turun kuat sedang terbentuk.
- Gunakan area yang disorot untuk mengonfirmasi momentum pasar yang kuat.
- Gabungkan dengan indikator lain (misalnya, volume, rata-rata bergerak) untuk konfirmasi tambahan.
Ringkasan
Key features include:
- Intuitive visualization of trend steepness expressed in degrees.
- Identification of market consolidation when the angle remains between +25° and -25°, and detection of strong bullish or bearish trends when breaking these thresholds.
- Color highlighting for quick recognition of strong uptrends (above +25°) and downtrends (below -25°).
- Compatibility with any timeframe and asset class, including stocks, forex, cryptocurrencies, and futures.
Users can monitor the trend angle line to determine market conditions, confirm momentum using highlighted regions, and combine this indicator with others such as volume or moving averages for enhanced analysis.
Ulasan pelanggan
5 | 100 % | |
4 | 0 % | |
3 | 0 % | |
2 | 0 % | |
1 | 0 % |

![Logo "High-Low Divergence [Iridio Capital]"](https://cdn.ctrader.com/image/webp/443c4661-7abb-40f1-842f-4b6ec560649b_40914)
![Logo "Wyckoff Toolkit [Iridio Capital]"](https://cdn.ctrader.com/image/webp/8acfe6a1-6a8e-4578-9367-9df3af2b1801_27763)
![Logo "Smart Money Concepts (SMC) [Iridio Capital]"](https://cdn.ctrader.com/image/webp/28b69fd1-ef54-4bed-9487-07e78e883be4_40934)
![Logo "Gaussian Channel [Iridio Capital]"](https://cdn.ctrader.com/image/webp/7c039209-5573-4a54-a072-f9528b503103_41960)
![Logo "Inverse Fair Value Gap (iFVG) [Iridio Capital]"](https://cdn.ctrader.com/image/webp/a7a0633e-91b0-4604-a6a8-1a4c30f68b0f_41954)
![Logo "Session Volume Profile (SVP) [Iridio Capital]"](https://cdn.ctrader.com/image/webp/60a274e6-2495-4d49-83f3-42078e40dc91_40920)
![Logo "Forecast Indicator [Iridio Capital]"](https://cdn.ctrader.com/image/webp/1d489900-f3bc-4a0c-ac55-368b41f69703_41986)