Descrizione
Indicatore di Pattern Istituzionale di MohammadKHR:
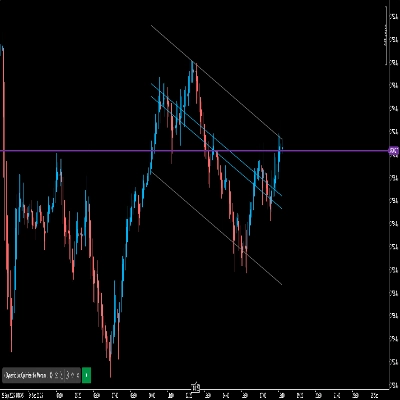
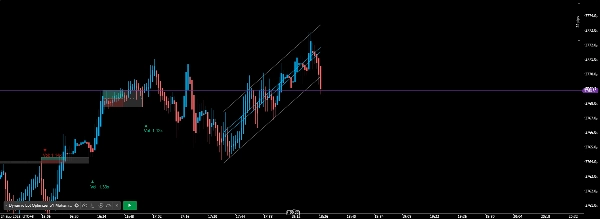
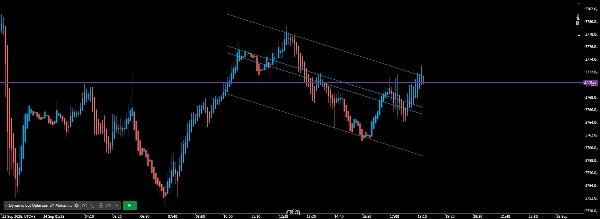
Guarda, il trading non riguarda segnali sofisticati o formule magiche. Riguarda struttura, pazienza e coerenza. Ecco esattamente perché ho creato questo strumento per darti un quadro chiaro, eliminare il rumore e aiutarti a concentrarti su ciò che conta davvero.
Questo indicatore funziona meglio se lo usi con disciplina. Ti mostra la struttura, l'attività, i livelli che hanno peso. Nient'altro, nientemeno. Il resto dipende da te, dalla tua pazienza, dal tuo mindset, dalla tua esecuzione.
Ho anche creato "Against the Herd" e "Institutional Level Edge Dashboard" e quando li combini con questo, copri ogni angolo del mercato. Onestamente, se rimani disciplinato, quel trio ti rende quasi inarrestabile. Non è esagerazione, è solo esperienza che parla.
Quindi non complicarti troppo. Mantienilo semplice, mantienilo disciplinato e lascia che gli strumenti facciano ciò per cui sono stati creati.
Riepilogo
Recensioni dei clienti
5 | 67 % | |
4 | 33 % | |
3 | 0 % | |
2 | 0 % | |
1 | 0 % |


