
Free Smart Money Concepts (SMC) from TradingView
Indicatore
3.25K download
Versione 1.0, Oct 2025
Windows, Mac
5.0
Recensioni: 8
Descrizione
- 🔷 Cos'è Smart Money Concepts (SMC)?
- SMC è un framework di price-action focalizzato su come il “denaro intelligente” istituzionale accumula e distribuisce posizioni.
- Sostituisce i modelli base con una mappa logica di struttura di mercato (BOS/CHoCH), liquidità (EQH/EQL), Order Blocks (OB), Fair Value Gaps (FVG), e zone premium/sconto per anticipare probabili continuazioni o inversioni.
- 🚀 Cosa fa questo indicatore
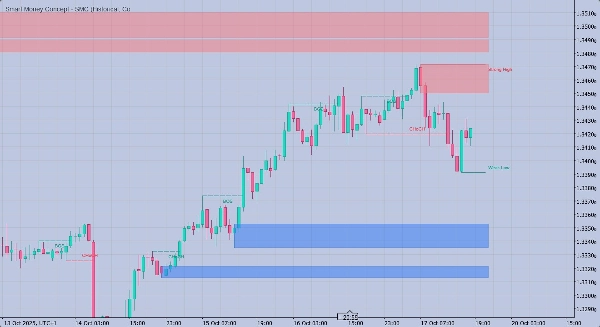
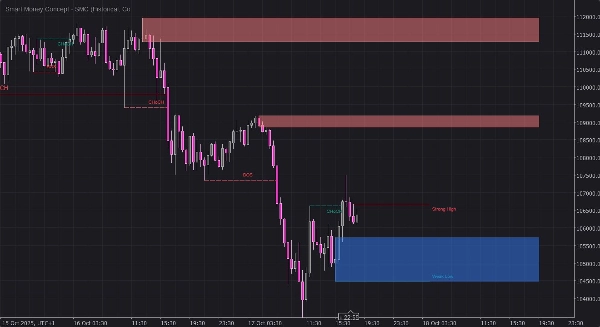
- Rileva Break of Structure (BOS) e Change of Character (CHoCH) sia nella struttura swing che in quella interna.
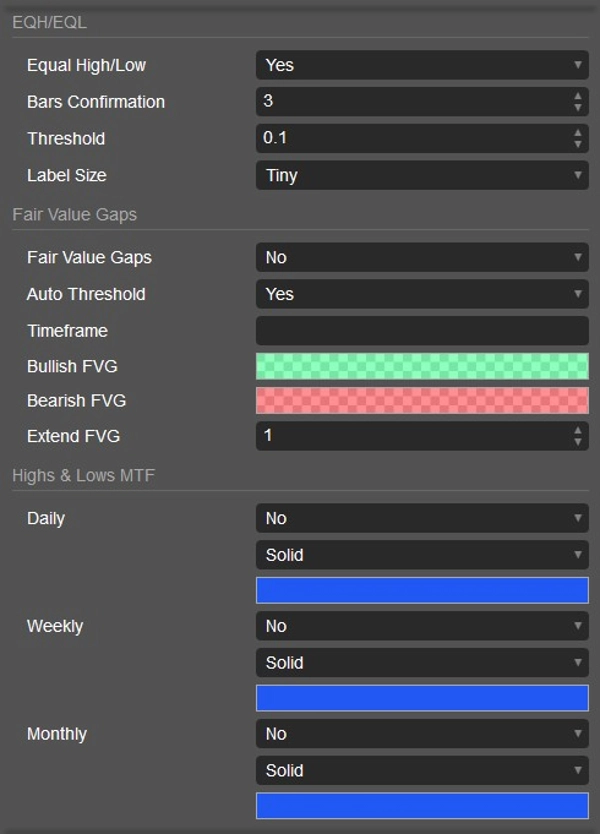
- Disegna Order Blocks (OB) e Fair Value Gaps (FVG) come zone semi-trasparenti (colori RGBA—l'opacità è completamente controllata dall'utente).
- Segna Equal Highs/Equal Lows (EQH/EQL) per mostrare le piscine di liquidità.
- Etichetta High/Low Forti/Deboli così puoi vedere quale lato è probabilmente preso di mira o protetto.
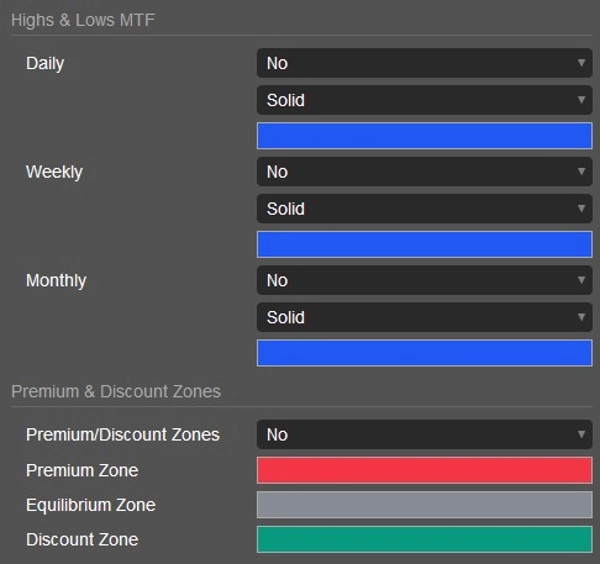
- Traccia zone Premium/Equilibrio/Sconto nell'intervallo swing corrente per il contesto dell'area di valore.
- Sovrappone massimi e minimi Giornalieri/Settimanali/Mensili per la confluenza multi-timeframe.
- Offre modalità di disegno Presente/Storica e stili Monocromatici/Colorati.
- 🧭 Come usarlo (flusso di lavoro pratico)
- 1) Leggi prima la struttura:
-
- Cerca BOS/CHoCH sui livelli swing e interni per stabilire il bias.
- Un BOS rialzista + BOS interno spesso segnala continuazione; un CHoCH avverte di una potenziale inversione.
- 2) Mappa squilibri e blocchi:
-
- Usa FVG come “obiettivi di efficienza” dove il prezzo spesso si riequilibra.
- Usa OB come probabili zone di mitigazione dove possono formarsi ingressi (es. ingressi limit o di conferma).
- 3) Allinea con la liquidità:
-
- Osserva EQH/EQL per sweep di liquidità; lo sweep + BOS è una forte narrazione SMC.
- Nota High/Low Forti/Deboli per valutare quale lato è vulnerabile.
- 4) Aggiungi confluenza:
-
- Controlla premium/sconto: le configurazioni di acquisto hanno probabilità più alte nello sconto; quelle di vendita nel premium.
- Aggiungi livelli MTF (D/W/M) e i tuoi orari di sessione per precisione.
- 5) Esegui e gestisci:
-
- Ingressi: mitigazione OB o riempimenti FVG con allineamento strutturale.
- Stop: oltre l'invalidazione dell'OB/FVG o il pivot forte più recente.
- Obiettivi: liquidità opposta, OB/FVG opposti, o equilibrio dello swing.
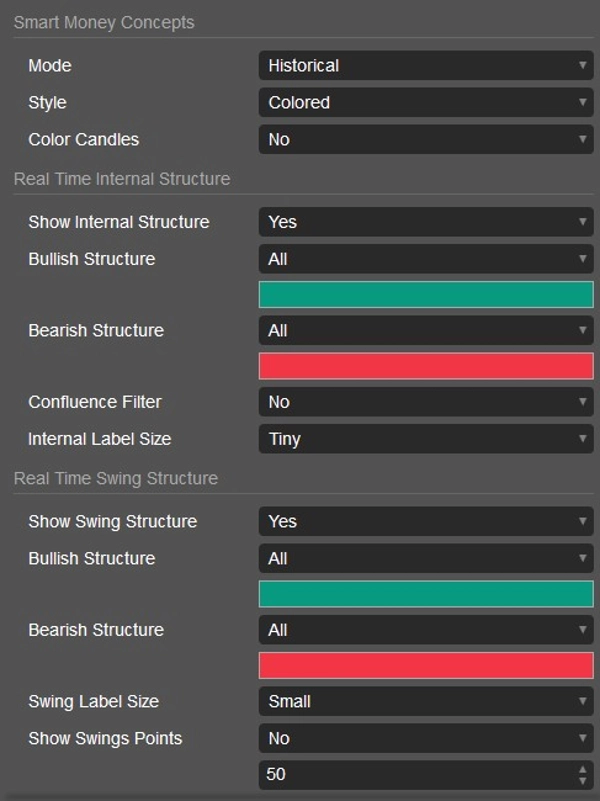
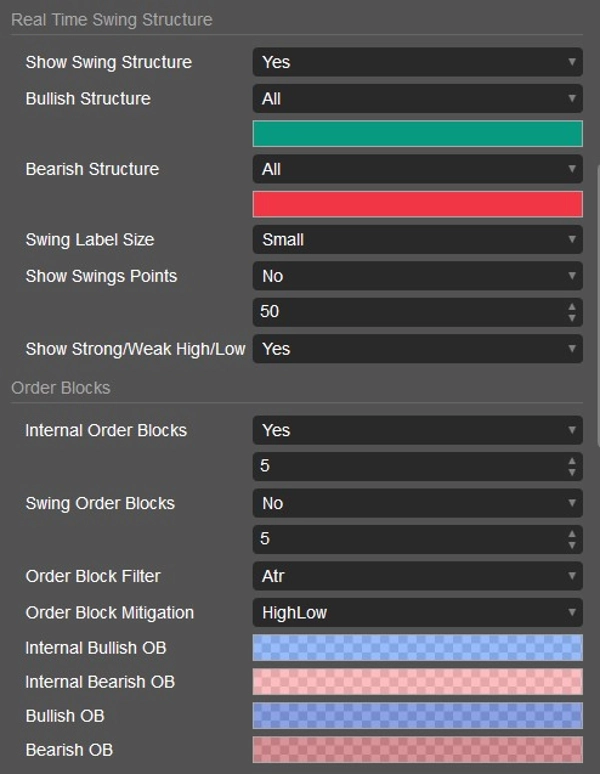
- ⚙️ Impostazioni chiave che controlli
- Modalità: Storica vs Presente (aspetto pulito in tempo reale).
- Filtri struttura: Mostra BOS/CHoCH per swing vs interno; dimensioni etichette; confluenza opzionale (logica delle ombre).
- Colori OB/FVG: Scegli qualsiasi colore RGBA; il canale alfa imposta direttamente la trasparenza.
- Conteggi/limiti: Numero massimo di OB visibili; estensione FVG; sensibilità EQH/EQL.
- Livelli MTF: Attiva Giornalieri/Settimanali/Mensili e scegli stili di linea.
- Stile: Colorato o Monocromatico, più colorazione opzionale delle candele per trend.
- 🧩 Perché piace ai trader
- Logica di parità 1:1 con il popolare approccio SMC di TradingView (parità BOS/CHoCH, OB/FVG).
- Visual puliti: le zone e le etichette rimangono leggibili e si aggiornano fluidamente in tempo reale.
- Flessibile: funziona dallo scalping allo swing trading, su qualsiasi simbolo o timeframe supportato da cTrader.
- ✅ Buone pratiche
- Combina il contesto SMC con gestione del rischio e un playbook chiaro (regole di ingresso, stop, target).
- Usa alert o watchlist intorno ai livelli HTF e alle aperture di sessione per movimenti di qualità superiore.
- Valida sempre con sessione di mercato e calendario delle notizie per evitare volatilità casuale.
- 📌 Note
- I visual dipendono dai dati del broker (i feed bid/sessioni possono variare).
- Questo strumento non è un consiglio finanziario; il trading comporta rischi. Usalo su un conto demo prima di passare al live.
Riepilogo
Riepilogo AI
Free Smart Money Concepts (SMC) indicator for cTrader replicates the TradingView SMC framework, focusing on institutional price action analysis. It identifies key market structure elements such as Break of Structure (BOS) and Change of Character (CHoCH) on both swing and internal levels to help establish trading bias. The indicator visually marks Order Blocks (OB) and Fair Value Gaps (FVG) as semi-transparent zones, highlighting potential entry and mitigation areas. It also detects Equal Highs/Lows (EQH/EQL) to indicate liquidity pools, and labels strong or weak highs and lows to assess market vulnerability.
Additional features include plotting premium, equilibrium, and discount zones within the current swing range for value-area context, and overlaying daily, weekly, and monthly highs and lows for multi-timeframe confluence. Users can customize drawing modes (present or historical), color schemes (monochrome or colored), and opacity levels for OB/FVG zones. The indicator supports flexible use across all symbols and timeframes available in cTrader, suitable for scalping to swing trading.
The workflow involves reading market structure, mapping imbalances and blocks, aligning with liquidity, adding confluence from premium/discount zones and multi-timeframe levels, and executing trades with defined entry, stop, and target rules. Visuals depend on broker data feeds. This tool is intended for analysis and does not provide financial advice.
Profilo indicatore
Recensioni dei clienti
5.0
Recensioni: 8
5 | 100 % | |
4 | 0 % | |
3 | 0 % | |
2 | 0 % | |
1 | 0 % |
Recensioni dei clienti
July 6, 2026
May 23, 2026
March 4, 2026
December 11, 2025
November 4, 2025
Superfantastic 3 in one zones, one of the best indicators on here ,and for free. If you cant figure it out after this, you got something wrong with ya :). Nicely done my friend, how did you code it C# or python?
Discussioni
Domande frequenti
BTCUSD
Forex
Signal
Breakout
Indices
EURUSD
Commodities
GBPUSD
NZDUSD
Fibonacci
Prop
ZigZag
Scalping
Fair Value Gap
SMC
Crypto
Stocks
XAUUSD
NAS100
ATR
USDJPY
I prodotti disponibili tramite cTrader Store, inclusi bot di trading, indicatori e plugin, sono forniti da sviluppatori terzi e resi disponibili esclusivamente a scopo informativo e di accesso tecnico. cTrader Store non è un broker e non fornisce consulenze in materia di investimento, raccomandazioni individualizzate o garanzie di risultati futuri.


![Logo di "[Stellar Strategies] Inside Bar with Signals"](https://cdn.ctrader.com/image/webp/1d9e8bfa-3b2c-4440-bb37-5856902008a7_30683)


Prezzo
46
Vendite
3.96K
Installazioni gratuite