
Descrizione
🚀 Oltre 10.000 trader usano già i nostri MIGLIORI indicatori🏆
Scopri perché i professionisti ci scelgono – gli strumenti più potenti su cTrader (indicatori, algoritmi e cBots) ti stanno aspettando.
👉 Ottieni tutti i nostri sistemi TOP qui:
_______________________________________________
📌 Indicatori di Struttura di Mercato
· 🔄 Analisi Dinamica della Struttura di Mercato dei Punti di Inversione
· 🧱 Blocco d'Ordine
· ⛓️ BOS & CHOCH
· 🧠 ICT Power of 3
· 🌀 Zone di Polarità di Mercato
_______________________________________________
🔚 Sistemi di Uscita Intelligenti
· 📍 Algoritmo Intelligente di Trailing
_______________________________________________
📐 Indicatori ZigZag
· 🔍 Proiezione della Liquidità del Prezzo ZigZag
· ➖ ZigZag
· 🎯 Tracciatore di Estremità Zig-Zag
_______________________________________________
🧱 Indicatori di Supporto e Resistenza
· 🟩 Linee di Supporto e Resistenza SmartTrend
· 🧱 Tutti i Livelli di Supporto e Resistenza
_______________________________________________
📊 Indicatori di Trend e Canale
· 🔄 Canale di Trend Automatico
· 📊 Supertrend
· ⚡Analizzatore di Trend Momentum
· 💥 Sistema di Breakout del Canale
· 🌈 Gradiente di Trend Dinamico
_______________________________________________
💧 Strumenti di Volume e Liquidità
· 🔥 Mappa di Calore Volume POC
· 📉 Mappa di Liquidazione della Leva
· 🕒 Sessioni di Fair Value Gap
_______________________________________________
⚡ Indicatori di Momentum e RSI
· 🔎 Tracciatore Multi-Livello di Bias delle Candele
Tracker
_______________________________________________
🔮 Strumenti di Predizione e Proiezione
· 📐 Predizione Basata su Linreg& ATR
· 📏 Regressione Lineare di FibonacciMulti-timeframe
· 📈 Proiettore di Flusso di Mercato Alimentato dal Volume
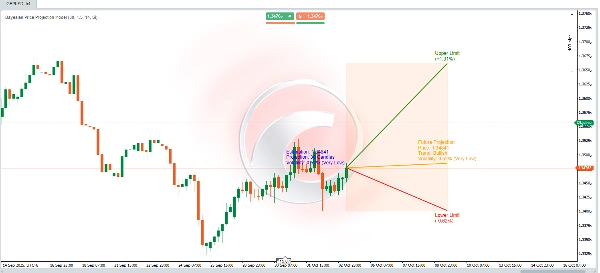
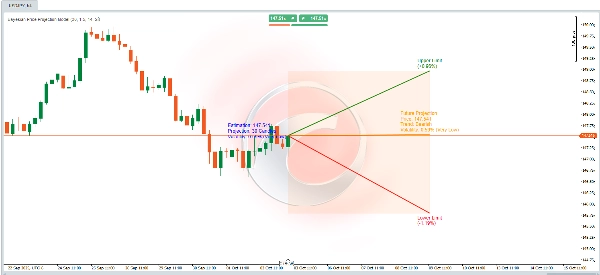
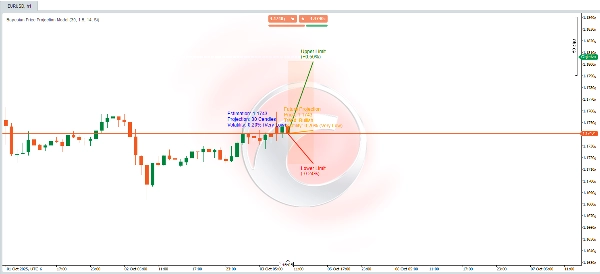
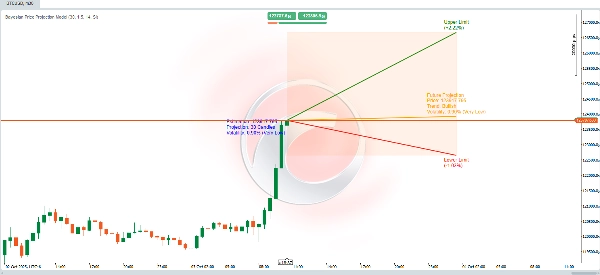
📊 Algoritmo Dinamico di Proiezione del Prezzo 📈
Questo algoritmo combina **calcoli statistici**, **analisi tecnica** e **teoria bayesiana** per prevedere un prezzo futuro fornendo **intervalli di incertezza** che rappresentano i limiti superiore e inferiore. I calcoli sono progettati per adattare le proiezioni considerando le **tendenze** di mercato, la **volatilità** e le probabilità storiche di raggiungere nuovi massimi o minimi.
Ecco come funziona:
🚀 Proiezione del Prezzo Futuro
Un calcolo dinamico stima il prezzo futuro basandosi su tre elementi chiave:
1. **Trend**: Definisce se il mercato è predisposto a muoversi verso l'alto o verso il basso.
2. **Volatilità**: Quantifica l'entità del cambiamento previsto basandosi sulle fluttuazioni storiche.
🧠 **Aggiustamento Probabilistico Bayesiano**
- Le probabilità condizionate sono calcolate usando la **formula di Bayes**:
\[
P(A|B) = \frac{P(B|A) \cdot P(A)}{P(B)}
\]
Questo modella eventi futuri usando informazioni condizionate:
- **Probabilità di raggiungere un nuovo massimo storico** se il prezzo è in trend rialzista.
- **Probabilità di raggiungere un nuovo minimo storico** se il prezzo è in trend ribassista.
- Queste probabilità affinano la stima del prezzo futuro considerando:
- **Maggiore volatilità** aumenta la probabilità di raggiungere livelli estremi (massimi/minimi).
- **Le tendenze di mercato** influenzano la direzione prevista del movimento del prezzo.
🌟 **Calcolo della Volatilità**
- La volatilità è misurata usando l'indicatore **ATR (Average True Range)** con una finestra di 14 periodi. Questo riflette l'ampiezza media delle fluttuazioni di prezzo.
- Per esprimere la volatilità in percentuale, l'ATR è normalizzato dividendolo per il prezzo di chiusura e moltiplicandolo per 200.
- La volatilità è quindi categorizzata in livelli descrittivi (es. **Molto Bassa**, **Bassa**, **Moderata**, ecc.) per una migliore interpretazione.
---
🎯 **Limiti di Deviazione (Superiore e Inferiore)**
- I limiti superiore e inferiore formano un **intervallo proiettato** attorno al prezzo futuro stimato, fornendo un quadro per l'incertezza.
- Questi limiti sono calcolati aggiustando l'ATR usando:
- Un **moltiplicatore** definito dall'utente (`factor_desviacion`).
- Le **probabilità bayesiane** calcolate in precedenza.
- La **radice quadrata del periodo proiettato** (`proyeccion_dias`), incorporando il principio che l'incertezza cresce nel tempo.
🔍 **Interpretazione del Modello**
Questo può essere visto come un **modello probabilistico dinamico** che:
- Combina **analisi tecnica** (trend e ATR).
- Affina le probabilità usando la **teoria bayesiana**.
- Fornisce un **intervallo di proiezione visiva** per aiutarti a comprendere i potenziali movimenti futuri del prezzo e le incertezze associate.
⚡ Che tu stia analizzando **mercati volatili** o confermando **scenari rialzisti/ribassisti**, questo strumento ti offre un approccio robusto e basato sui dati! 🚀


