
ORB_BRSTrading
Indicatore
1 acquisti
Versione 1.0, Nov 2025
Windows, Mac
4.6
Recensioni: 3
Descrizione
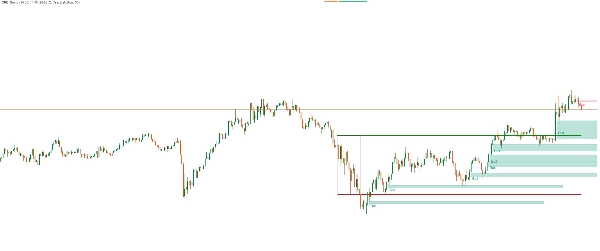
Questo indicatore implementa una strategia di trading Opening Range Breakout (ORB), progettata per catturare il momentum durante il periodo più volatile della sessione di trading. Identifica l'intervallo di apertura basato su parametri temporali definiti dall'utente e traccia i livelli di breakout per potenziali segnali di ingresso. La strategia mira a sfruttare i movimenti di prezzo quando il mercato rompe al di sopra o al di sotto dell'intervallo iniziale, segnalando spesso forti tendenze direzionali.
Caratteristiche principali:
- Finestra temporale personalizzabile per l'intervallo di apertura
- Calcolo automatico dei livelli di breakout
- Avvisi visivi per la conferma del breakout
- Funziona su più timeframe e strumenti
- Ideale per trader intraday alla ricerca di setup ad alta probabilità
Come funziona:
- Definisce l'intervallo di apertura (massimo e minimo) per un periodo di tempo specificato.
- Monitora l'azione del prezzo per breakout oltre questo intervallo.
- Genera segnali di trading basati sulla direzione del breakout e filtri opzionali (ad esempio, volume, volatilità).
Riepilogo
Riepilogo AI
ORB_BRSTrading is an indicator implementing an Opening Range Breakout (ORB) trading strategy aimed at capturing momentum during the most volatile period of a trading session. It defines the opening range high and low based on user-specified time parameters and automatically calculates breakout levels. The indicator monitors price action for breakouts beyond this range and generates trade signals according to breakout direction, with optional filters such as volume or volatility. It provides visual alerts to confirm breakouts and supports multiple timeframes and instruments, making it suitable for intraday traders seeking high-probability setups. The strategy is applicable across various markets including Forex, stocks, indices, and symbols like BTCUSD, EURUSD, GBPUSD, XAUUSD, NAS100, and USDJPY.
Profilo indicatore
Recensioni dei clienti
4.6
Recensioni: 3
5 | 67 % | |
4 | 33 % | |
3 | 0 % | |
2 | 0 % | |
1 | 0 % |
Recensioni dei clienti
February 9, 2026
ORB_BRSTrading is a solid Opening Range Breakout tool. Clean visuals and reliable logic make it work best on M10-H4. Great for intraday and session-based breakout strategies. Less effective on very low or very high timeframes.
December 10, 2025
December 2, 2025
Discussioni
Domande frequenti
BTCUSD
Forex
Breakout
Indices
EURUSD
GBPUSD
NZDUSD
Stocks
XAUUSD
NAS100
USDJPY
I prodotti disponibili tramite cTrader Store, inclusi bot di trading, indicatori e plugin, sono forniti da sviluppatori terzi e resi disponibili esclusivamente a scopo informativo e di accesso tecnico. cTrader Store non è un broker e non fornisce consulenze in materia di investimento, raccomandazioni individualizzate o garanzie di risultati futuri.
Altro da questo autore


Prezzo
Da 22/10/2025
303.42M
Volume negoziato
49
Profitto in pip
1
Vendite