


Descrizione
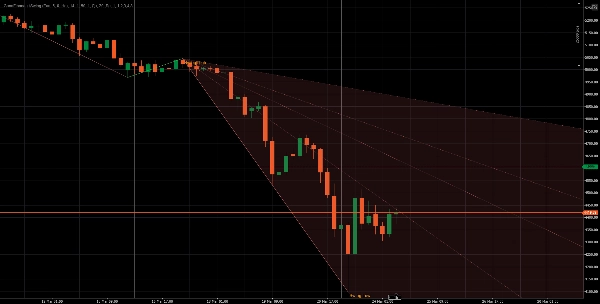
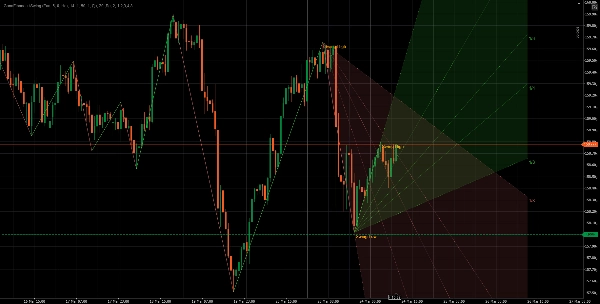
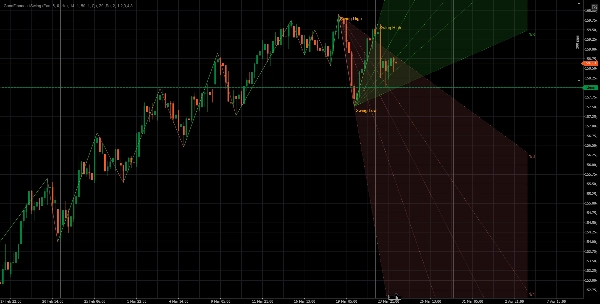
Il Gann Fibonacci Swing è un indicatore di analisi tecnica avanzata progettato per la piattaforma cTrader. Combina rilevamento della struttura di mercato swing (basata sui pivot) con la geometria del Gann Fan e la logica di ritracciamento/estensione di Fibonacci, fornendo ai trader un potente strumento per identificare tendenze, livelli chiave e potenziali zone di inversione.
L'indicatore rileva dinamicamente gli swing di mercato (massimi e minimi), costruisce un'analisi strutturale e quindi visualizza questi dati in due modalità principali:
- Modalità Gann Fan
- Modalità Fibonacci Box
Concetto Fondamentale
L'indicatore opera in tre fasi principali:
1. Rilevamento Swing (Logica ZigZag)
- Utilizza un algoritmo basato sui pivot per rilevare massimi e minimi locali
- Un pivot è confermato solo dopo un numero specificato di barre (Profondità Pivot)
- Filtri:
-
- Movimento minimo del prezzo (pips)
- Facoltativo filtro di volatilità basato su ATR
Questo garantisce che vengano considerati solo gli swing di mercato significativi.
2. Costruzione dello Swing
Ogni swing consiste in:
- Punto di partenza (pivot)
- Punto finale (pivot)
- Direzione:
-
- Swing rialzista: Minimo → Massimo
- Swing ribassista: Massimo → Minimo
L'indicatore può tracciare più swing recenti basati su Profondità di Disegno dello Swing.
3. Modalità di Visualizzazione
Modalità 1: Gann Fan
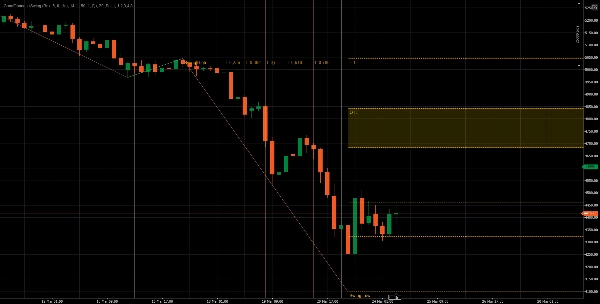
In questa modalità, l'indicatore disegna linee a ventaglio in stile Gann dal punto di inizio dello swing.
Caratteristiche:
- Le linee a ventaglio sono calcolate utilizzando:
-
- Pendenza base dello swing
- Divisa per denominatori definiti dall'utente (es. 1, 2, 3, 4, 8)
- Regolabili:
-
- Scala (moltiplicatore della pendenza)
- Proiezione nelle barre future
- Opzionali:
-
- Riempimento della zona tra le linee a ventaglio
- Etichette delle linee (es. 1/1, 1/2, 1/3)
Interpretazione:
- Le linee a ventaglio fungono da supporto/resistenza dinamico
- L'interazione del prezzo con queste linee può indicare:
-
- Continuazione della tendenza
- Indebolimento o inversione della tendenza
Modalità 2: Fibonacci Box
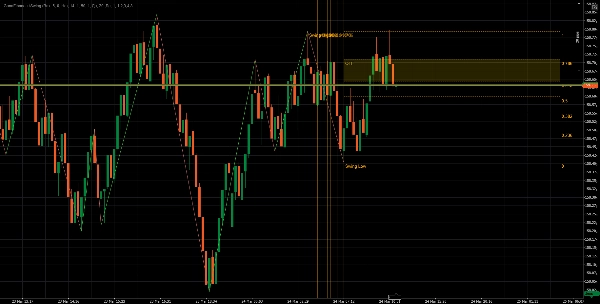
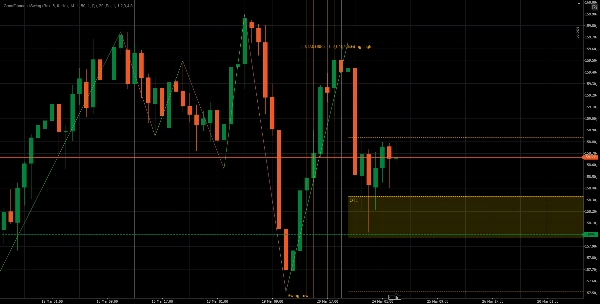
Questa modalità costruisce una struttura prezzo-tempo basata sui rapporti di Fibonacci.
Caratteristiche:
1. Livelli Orizzontali di Fibonacci
- Tracciati tra massimo e minimo dello swing
- Rapporti comuni:
- Può essere invertito usando la Modalità Inversa
2. Divisioni Temporali
- Linee verticali che dividono la durata dello swing usando rapporti di Fibonacci
- Aiuta a identificare zone di confluenza basate sul tempo
3. Zona OTE (Optimal Trade Entry)
- Zona evidenziata tra:
- Agisce come una zona di ritracciamento ad alta probabilità
Visualizzazione ZigZag
- Visualizzazione opzionale della struttura dello swing usando linee connesse
- Aiuta a identificare visivamente:
-
- Struttura di mercato
- Massimi più alti / minimi più bassi
Etichette e Annotazioni
- Punti di swing etichettati:
-
- “Swing Low”
- “Swing High”
- Livelli di Fibonacci e rapporti del ventaglio opzionalmente etichettati
Sistema di Avvisi
L'indicatore include un meccanismo di avviso:
Attivazione:
- Quando il prezzo entra nella zona OTE
Caratteristiche:
- Funziona su chiusura della barra
- Opzionale:
-
- Notifica sonora
- Si attiva una sola volta per ingresso nella zona (nessun avviso ripetuto mentre si è all'interno)
Parametri Chiave
Rilevamento Swing
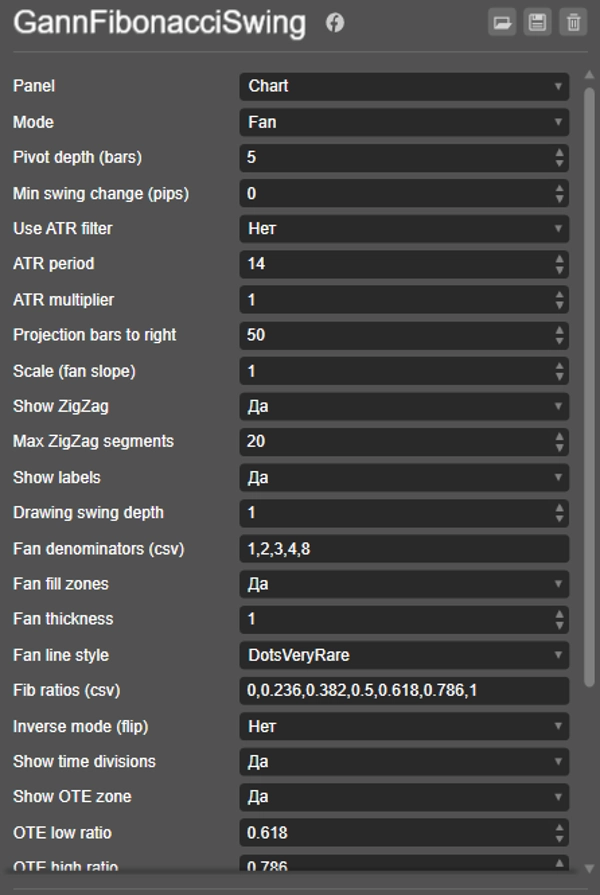
- Profondità Pivot — sensibilità del rilevamento pivot
- Min Swing Pips — movimento minimo del prezzo
- Filtro ATR — filtraggio basato sulla volatilità
Visualizzazione
- Profondità di Disegno dello Swing — numero di swing visualizzati
- Barre di Proiezione — quanto lontano si estendono i disegni nel futuro
Impostazioni Gann Fan
- Rapporti del ventaglio (denominatori)
- Spessore e stile delle linee
- Riempimento della zona
Impostazioni Fibonacci Box
- Rapporti di Fibonacci
- Modalità inversa
- Divisioni temporali
- Configurazione della zona OTE
Avvisi
- Abilita/disabilita avvisi
- Avvisi al tocco della zona OTE
- Impostazioni sonore
Come Funziona nella Pratica
- L'indicatore rileva i pivot → costruisce gli swing
- Gli swing completati più recenti vengono selezionati
- A seconda della modalità:
-
- Vengono disegnate linee a ventaglio O struttura Fibonacci
- Il trader osserva:
-
- Livelli chiave
- Zone di confluenza
- Geometria della tendenza
- Gli avvisi notificano quando il prezzo raggiunge zone ottimali
Casi d'Uso
Questo indicatore è utile per:
- Analisi delle tendenze
- Ottimizzazione dell'ingresso (zone OTE)
- Supporto/resistenza dinamico
- Strategie di swing trading
- Sistemi di trading basati sulla confluenza
Vantaggi
- Combina Gann + Fibonacci + struttura di mercato
- Adattivo alla volatilità (filtro ATR)
- Funziona in tempo reale e dati storici
- Altamente personalizzabile
- Output visivo pulito con ottimizzazione delle prestazioni
Conclusione
L'indicatore Gann Fibonacci Swing è uno strumento analitico ibrido che unisce la struttura dell'azione del prezzo con l'analisi geometrica e basata sui rapporti. Fornisce ai trader un modo strutturato per interpretare gli swing di mercato, identificare zone ad alta probabilità e anticipare il comportamento futuro del prezzo.
Riepilogo
The indicator supports customizable parameters including pivot depth, minimum swing pips, ATR filter, number of swings displayed, projection bars, fan ratios, line styles, Fibonacci ratios, inverse mode, and alert settings. It features optional ZigZag visualization of market structure and labels for swing points and Fibonacci levels. Alerts can notify users when price enters the OTE zone, with sound options and single-trigger functionality.
Designed for trend analysis, entry optimization, dynamic support/resistance identification, swing trading, and confluence-based systems, the Gann Fibonacci Swing combines price action structure with geometric and ratio-based tools to help traders interpret market swings and anticipate price behavior.
Recensioni dei clienti
Discussioni
Domande frequenti
Altro da questo autore




















Prezzo