Beschreibung
Clustering-Indikator
Überblick
Der Clustering-Indikator ist ein leistungsstarkes Werkzeug, das Tradern hilft, Muster, Trends und Anomalien in Marktdaten zu erkennen. Durch das Gruppieren ähnlicher Datenpunkte in Cluster liefert dieser Indikator wertvolle Einblicke, die für fundierte Handelsentscheidungen genutzt werden können.
Funktionen
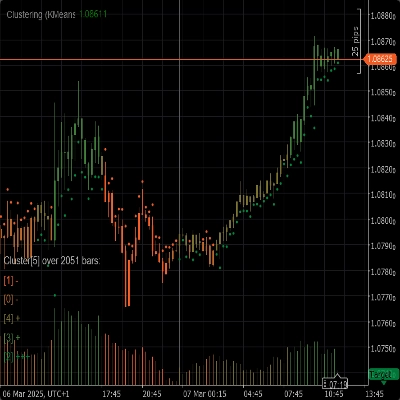
- Clustering-Algorithmen: Nutzt fortschrittliche Clustering-Algorithmen wie K-Means und Gaussian Mixture Model (GMM), um Marktdaten effektiv zu segmentieren.
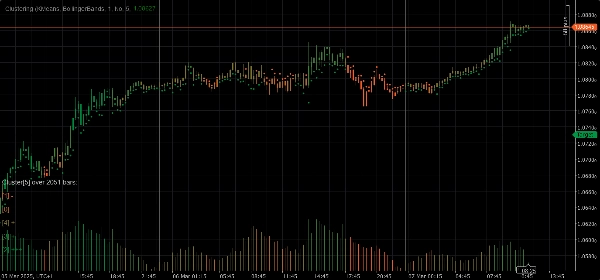
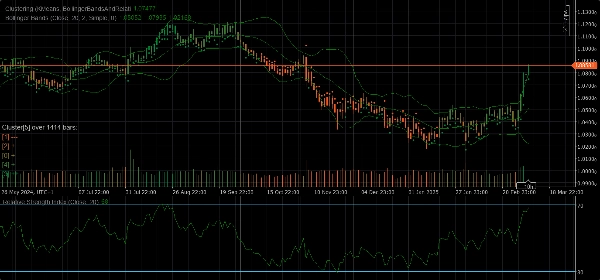
- Merkmalssets: Bietet eine Vielzahl von Merkmalssets, darunter Rohpreis, Bollinger-Bänder, Relative Strength Index (RSI), Stochastischer Oszillator, Bollinger-Bänder und RSI sowie Kombinationen dieser Indikatoren, um verschiedene Aspekte des Marktverhaltens abzubilden.
- Dynamisches Clustering: Bestimmt automatisch die optimale Anzahl der Cluster, um eine möglichst genaue Clusterbildung zu gewährleisten.
- Visualisierung: Bietet klare visuelle Einblicke in Clusterbewegungen und Volatilität direkt in Ihrem Chart.
Parameter
- Clustering-Algorithmus: Wählen Sie zwischen K-Means oder Gaussian Mixture Model (GMM), um Ihre Handelsstrategie bestmöglich anzupassen.
- Merkmalsset: Wählen Sie aus Rohpreis, Bollinger-Bändern, RSI, Stochastischem Oszillator, Bollinger-Bändern und RSI oder einem vollständigen Marktdatensatz mit verschiedenen Indikatoren.
- Fenster: Definieren Sie die Anzahl der Bars, die für jeden Datenpunkt berücksichtigt werden sollen.
- Auto K: Bestimmt automatisch die Anzahl der Cluster basierend auf Ihren Daten.
- Initial K: Legen Sie eine Anfangsanzahl von Clustern fest, wenn Auto K deaktiviert ist.
- Maximale historische Bars: Begrenzen Sie die maximale Anzahl historischer Bars, die für das Clustering verwendet werden. Wenn auf 0 gesetzt, werden alle verfügbaren Bars verwendet.
- Färbung nach Clustern: Aktivieren oder deaktivieren Sie die Neufärbung des Charts basierend auf den tatsächlichen Clusterzuweisungen.
- Einblicke anzeigen: Zeigen Sie detaillierte Einblicke zu jedem Cluster direkt im Chart an.
- Indikatoren anzeigen: Zeigen Sie die in den Merkmalssets verwendeten Indikatoren an.
Parameter für automatische Anpassung
- Automatische Anpassung: Aktivieren oder deaktivieren Sie den Auto-Anpassungsmodus, der es dem Indikator ermöglicht, Cluster basierend auf festgelegten Bedingungen neu zu initialisieren.
- Stunde der automatischen Anpassung: Die Tagesstunde, zu der eine automatische Anpassung erfolgen kann (0-23).
- Zeitraum der automatischen Anpassung: Die Mindestanzahl an Stunden, die seit der letzten Anpassung vergehen müssen, bevor eine weitere Anpassung erfolgen kann.
Parameter für Merkmalssets
Parameter der Bollinger-Bänder
- Periode: Die Periode zur Berechnung der Bollinger-Bänder.
- Abweichung: Der Multiplikator der Standardabweichung für die Bollinger-Bänder.
- Typ des gleitenden Durchschnitts: Der Typ des gleitenden Durchschnitts, der bei der Berechnung der Bollinger-Bänder verwendet wird (einfach, exponentiell usw.).
Parameter des Relative Strength Index (RSI)
- Periode: Die Periode zur Berechnung des RSI.
Parameter des Stochastischen Oszillators
- Periode: Die K-Periode für den Stochastischen Oszillator.
- K-Verlangsamung: Der K-Verlangsamungsfaktor für den Stochastischen Oszillator.
- D-Periode: Die D-Periode für den Stochastischen Oszillator.
- Typ des gleitenden Durchschnitts: Der Typ des gleitenden Durchschnitts, der bei der Berechnung des Stochastischen Oszillators verwendet wird (einfach, exponentiell usw.).
- Berechnungstyp: Der Berechnungstyp für den Stochastischen Oszillator (LowHigh, CloseClose usw.).
Anwendung
1. Fügen Sie den Clustering-Indikator Ihrem Chart hinzu.
2. Konfigurieren Sie die Parameter entsprechend Ihrer Handelsstrategie.
3. Analysieren Sie die Cluster und deren Bewegungen im Chart.
4. Nutzen Sie die vom Indikator bereitgestellten Einblicke, um fundierte Handelsentscheidungen zu treffen.
Zusammenfassung
Kundenbewertungen
5 | 50 % | |
4 | 50 % | |
3 | 0 % | |
2 | 0 % | |
1 | 0 % |


