
Descrizione
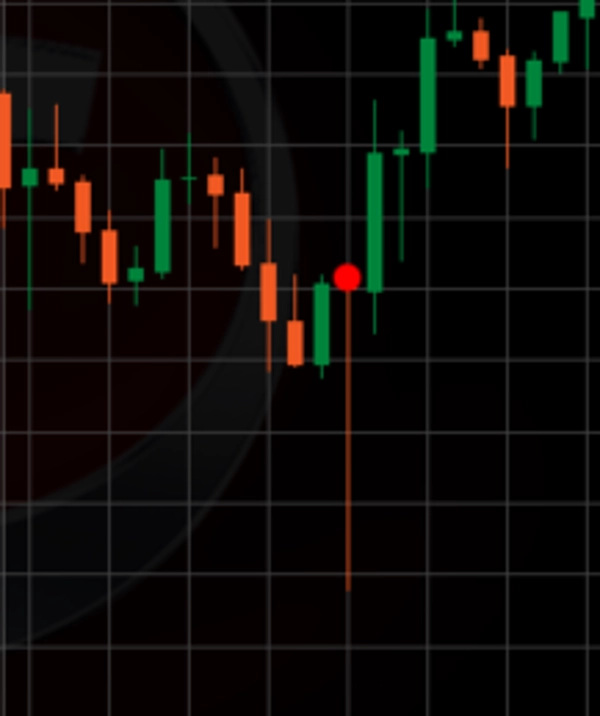
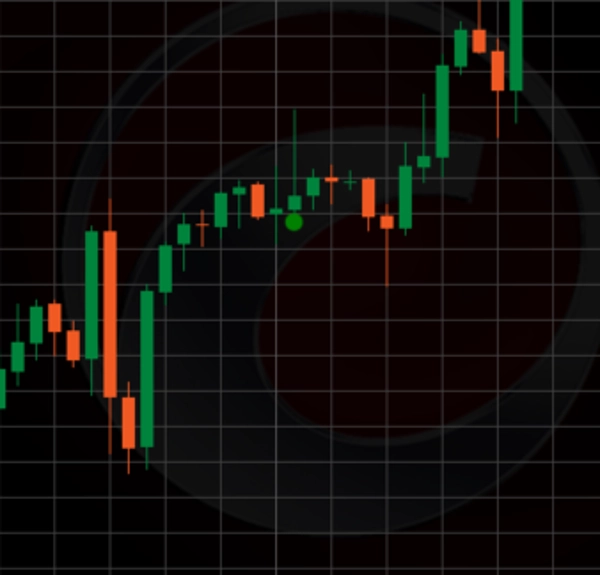
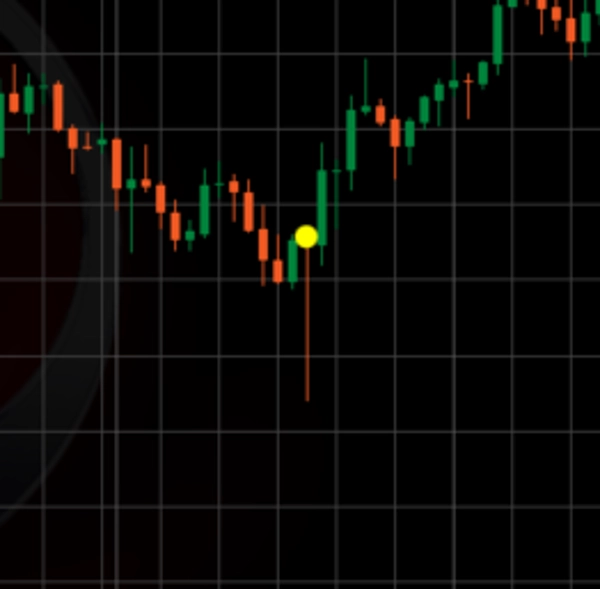
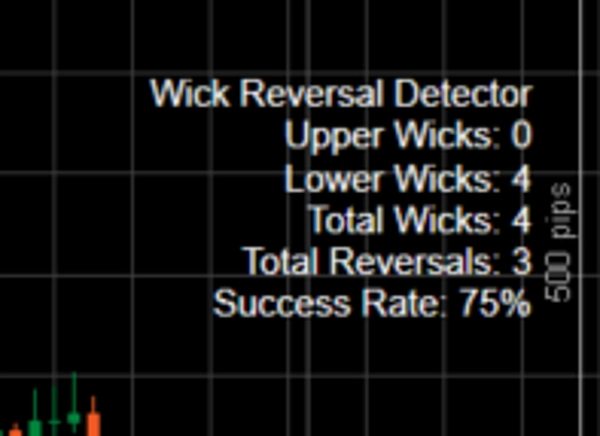
L'indicatore Long Wick è uno strumento potente di analisi tecnica progettato per cTrader che si concentra sull'identificazione di candele con stoppini insolitamente lunghi—sia superiori che inferiori—rispetto alla dimensione del corpo e alla media dell'intervallo della candela. Evidenzia questi stoppini sul grafico come potenziali punti di inversione, dove il mercato potrebbe aver respinto prezzi più alti (per stoppini superiori, suggerendo un'inversione ribassista) o prezzi più bassi (per stoppini inferiori, suggerendo un'inversione rialzista). L'indicatore utilizza una combinazione di un moltiplicatore di soglia dello stoppino, un rapporto minimo stoppino-corpo e una media mobile semplice (SMA) per filtrare il rumore e concentrarsi su modelli significativi di rifiuto del prezzo. Ogni stoppino rilevato è contrassegnato con un cerchio (verde per stoppini superiori, rosso per stoppini inferiori se confermati come inversioni, o giallo se non confermati), e i dati statistici (ad esempio, stoppini totali, inversioni e tasso di successo) sono visualizzati sul grafico per un facile monitoraggio.
Come Usare nel Trading:
- Identificazione delle Opportunità di Inversione: Usa l'indicatore per individuare stoppini lunghi che si verificano a livelli chiave di supporto o resistenza, o contro la tendenza prevalente (ad esempio, uno stoppino inferiore lungo in un trend ribassista per una potenziale inversione rialzista). Un cerchio verde o rosso solido indica un'inversione confermata basata sull'azione del prezzo nel periodo di lookforward, rappresentando un segnale per considerare l'ingresso in una posizione nella direzione opposta (ad esempio, comprare su un'inversione con stoppino inferiore rosso, vendere su un'inversione con stoppino superiore verde).
- Conferma con Altri Strumenti: Combina l'indicatore Long Wick con altri indicatori tecnici (ad esempio, RSI, MACD o linee di supporto/resistenza) per confermare i segnali di inversione ed evitare falsi positivi, specialmente in mercati volatili.
- Gestione del Rischio: Posiziona ordini stop-loss oltre l'estremo dello stoppino (ad esempio, sotto il minimo per un'inversione rialzista) per proteggerti dalla possibilità che l'inversione fallisca, e imposta livelli di take-profit basati su supporti/resistenze vicini o su un rapporto rischio-rendimento (ad esempio, 1:2).
- Monitoraggio del Tasso di Successo: Controlla regolarmente il tasso di successo visualizzato per valutare l'efficacia dell'indicatore nel tempo e adatta di conseguenza la tua strategia.
Regolazione dei Parametri per un Uso Ottimale:
- Periodo di Lookback (Predefinito: 5): Determina il numero di barre utilizzate per calcolare la media dell'intervallo della candela. Un periodo più breve (ad esempio, 3-10) rende l'indicatore più sensibile alla volatilità recente, ideale per mercati veloci, mentre un periodo più lungo (ad esempio, 20-50) smussa la media per condizioni di trend più stabili. Regola in base al tuo timeframe (ad esempio, più basso per grafici a 1 minuto, più alto per grafici a 1 ora).
- Periodo di Lookforward (Predefinito: 15): Imposta il numero di barre per confermare un'inversione. Un periodo più breve (ad esempio, 5-10) è adatto a strategie di scalping rapide, mentre un periodo più lungo (ad esempio, 15-30) è migliore per lo swing trading per catturare inversioni prolungate. Aumenta se noti troppe marcature gialle dove le inversioni si verificano più tardi.
- Moltiplicatore di Soglia dello Stoppino (Predefinito: 1.3): Moltiplica la media dell'intervallo della candela per impostare la lunghezza minima dello stoppino. Valori più bassi (ad esempio, 1.0-1.5) rilevano più stoppini (utile in mercati a bassa volatilità), mentre valori più alti (ad esempio, 2.0-3.0) filtrano solo gli stoppini più significativi (migliore in mercati ad alta volatilità). Regola per bilanciare sensibilità e qualità del segnale.
- Periodo di Trend (SMA) (Predefinito: 21): Definisce la lunghezza della SMA per il filtraggio del trend. Un periodo più breve (ad esempio, 10-20) risponde a trend a breve termine, mentre un periodo più lungo (ad esempio, 50-100) si allinea a trend a lungo termine. Regola per adattarti al tuo orizzonte di trading e alle condizioni di mercato.
- Rapporto Minimo Stoppino-Corpo (Predefinito: 3): Imposta il rapporto minimo tra la lunghezza dello stoppino e la dimensione del corpo. Un rapporto più basso (ad esempio, 2-3) include più candele con stoppini moderati, mentre un rapporto più alto (ad esempio, 4-5) si concentra su candele con stoppini molto pronunciati. Aumenta per segnali di inversione più rigorosi, diminuisci per più opportunità.
- Tolleranza di Inversione (Pips) (Predefinito: 5): Consente una tolleranza in pips affinché il prezzo si estenda oltre l'estremo dello stoppino prima di squalificare un'inversione. Un valore più piccolo (ad esempio, 2-3) garantisce una conferma rigorosa dell'inversione, mentre un valore più grande (ad esempio, 5-10) accoglie piccoli ritracciamenti. Regola in base al valore del pip del simbolo e alla volatilità.
Consigli per l'Ottimizzazione:
- Inizia con le impostazioni predefinite e fai backtest sui dati storici per il tuo strumento e timeframe preferiti.
- Nei mercati in trend, aumenta il Moltiplicatore di Soglia dello Stoppino e il Rapporto Minimo Stoppino-Corpo per concentrarti su segnali di inversione più forti.
- Nei mercati laterali, abbassa questi parametri per catturare più stoppini, ma abbinali a un periodo di Lookforward più breve per evitare squalifiche tardive.
- Rivedi regolarmente il tasso di successo e adatta i parametri se scende sotto la soglia accettabile (ad esempio, 70%).
Personalizzando questi parametri, i trader possono adattare l'indicatore Long Wick alla loro strategia specifica, migliorandone l'efficacia nell'individuare punti di inversione ad alta probabilità in varie condizioni di mercato.
Riepilogo
Traders can use the indicator to spot reversal opportunities at key support or resistance levels or against prevailing trends. It is recommended to confirm signals with other technical tools such as RSI or MACD and to apply risk management by placing stop-loss orders beyond wick extremes. The indicator’s parameters—including lookback and lookforward periods, wick threshold multiplier, SMA trend period, minimum wick-to-body ratio, and reversal tolerance—are adjustable to suit different market conditions and trading styles. Regular review of the success rate helps optimize performance.
Recensioni dei clienti
5 | 0 % | |
4 | 100 % | |
3 | 0 % | |
2 | 0 % | |
1 | 0 % |


![Logo di "[Stellar Strategies] Smart ADX"](https://cdn.ctrader.com/image/webp/af13b084-b6f6-41db-b7bc-c7e688b57b05_36929)


