Beschreibung
📌 Funktionen & Merkmale
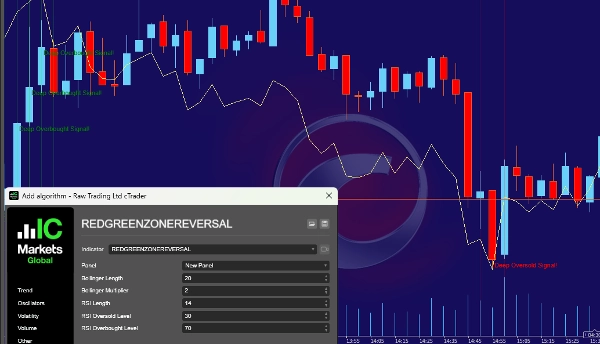
- Bollinger-Bänder (20-Perioden-SMA mit einer Standardabweichung von 2)
-
- Oberes Band: Zeigt überkaufte Niveaus an.
- Unteres Band: Zeigt überverkaufte Niveaus an.
- Relative Strength Index (RSI) (14-Perioden)
-
- RSI über 70 → Markt ist überkauft (übermäßiger Kaufdruck).
- RSI unter 30 → Markt ist überverkauft (übermäßiger Verkaufsdruck).
- Erkennt Umkehrzonen:
-
- Rote Zone (Überverkauft):
-
- Schlusskurs liegt unter dem unteren Bollinger-Band.
- RSI liegt unter 30 (starker Verkaufsdruck).
- Bedeutung: Der Markt ist überverkauft, eine potenzielle Kaufgelegenheit.
- Grüne Zone (Überkauft):
-
- Schlusskurs liegt über dem oberen Bollinger-Band.
- RSI liegt über 70 (starker Kaufdruck).
- Bedeutung: Der Markt ist überkauft, eine potenzielle Verkaufsgelegenheit.
- Visuelle Chart-Markierungen:
-
- Rot schattierte Zone bei Überverkauft (potenzielle Kaufgelegenheit).
- Grün schattierte Zone bei Überkauft (potenzielle Verkaufsgelegenheit).
- Warnungen & Tonsignale:
-
- Text erscheint im Chart („Tiefes Überverkauft-Signal!“ oder „Tiefes Überkauft-Signal!“).
- Tonsignale ertönen, wenn eine überkaufte/überverkaufte Bedingung erkannt wird.
🎯 Wie hilft dieser Indikator Händlern?
✅ Bietet Warnsignale für potenzielle Marktumkehrungen (bei extremen Kursniveaus).
✅ Hilft Händlern, starke Ein- und Ausstiegspunkte zu finden.
✅ Kombiniert Bollinger-Bänder und RSI für zuverlässige Erkennung von Überkauft-/Überverkauft-Zuständen.
✅ Geeignet für Daytrading, Swing-Trading und Scalping auf verschiedenen Zeitrahmen.
🚀 Zusammenfassung:
Dieser Indikator hilft dabei, überkaufte und überverkaufte Zustände zu erkennen und warnt wenn eine Kursumkehr wahrscheinlich ist. Händler können dies nutzen, um kluge Kauf- und Verkaufsentscheidungen zu treffen!
🚨 Haftungsausschluss für Handelsrisiken 🚨
Der Handel mit Finanzinstrumenten, einschließlich Aktien, Forex, Kryptowährungen, Rohstoffen und Derivaten, birgt ein hohes Risiko und ist nicht für alle Anleger geeignet. Bevor Sie mit dem Handel beginnen, ist es wichtig, die Risiken zu verstehen und Ihre finanzielle Situation, Erfahrung und Risikotoleranz sorgfältig zu prüfen.
Märkte können sehr volatil sein, und Kursbewegungen können aufgrund von Wirtschaftsdaten, geopolitischen Ereignissen, Marktsentiment oder unerwarteten Nachrichten plötzlich und unvorhersehbar sein. Diese Volatilität kann zu erheblichen Gewinnen, aber auch zu erheblichen Verlusten führen. Märkte können sich schnell gegen Ihre Position bewegen, Stop-Losses und Risikomanagementstrategien garantieren keinen Verlustschutz, und Hebelwirkung kann sowohl Gewinne als auch Verluste verstärken, die Ihr ursprüngliches Investment übersteigen können.
Es gibt keine Garantie, dass eine Handelsstrategie, ein technischer Indikator oder eine Methode Gewinne erzielt. Die historische Performance garantiert keine zukünftigen Ergebnisse, und vergangene Erfolge sichern keine zukünftigen Gewinne. Selbst professionelle Händler erleiden Verluste, Marktbedingungen ändern sich ständig, und zukünftige Bewegungen mit Sicherheit vorherzusagen ist unmöglich. Handel sollte niemals ausschließlich auf Spekulation oder Emotionen basieren.
Der Einsatz von Hebel oder Margin-Handel ermöglicht es Ihnen, größere Positionen mit einem kleineren Kapitaleinsatz zu kontrollieren, erhöht jedoch auch das Risiko erheblich. Hebel kann zu einem schnellen Kapitalverlust führen, Margin Calls können die Liquidation von Positionen zu ungünstigen Preisen erzwingen, und der Handel auf Margin kann dazu führen, dass Sie mehr Geld verlieren als ursprünglich eingezahlt. Zusätzlich können Liquiditätsrisiken und Slippage auftreten, was bedeutet, dass möglicherweise nicht genügend Käufer oder Verkäufer zu einem bestimmten Zeitpunkt vorhanden sind und Aufträge nicht zu den erwarteten Preisen ausgeführt werden. Marktlücken können zu plötzlichen Kursprüngen führen, die Stop-Loss-Level vollständig umgehen.
Handel erfordert Disziplin, Geduld und emotionale Kontrolle. Angst, Gier und Übervertrauen führen oft zu schlechten Handelsentscheidungen und erhöhen die Wahrscheinlichkeit von Verlusten. Emotionaler Handel kann zu impulsiven und irrationalen Entscheidungen führen, während die Angst, etwas zu verpassen (FOMO), und Rachehandel zu übermäßigem Risiko führen können. Die Entwicklung einer klaren Strategie und das Festhalten an einem Risikomanagementplan sind entscheidend.
Regulatorische und rechtliche Risiken müssen ebenfalls berücksichtigt werden, da verschiedene Jurisdiktionen unterschiedliche Vorschriften für Handel und Investitionen haben. Einige Finanzprodukte sind möglicherweise in Ihrem Land nicht verfügbar, und regulatorische Änderungen können die Marktbedingungen beeinflussen. Stellen Sie stets die Einhaltung lokaler Gesetze und Finanzvorschriften sicher, handeln Sie mit seriösen und regulierten Brokern oder Börsen und vermeiden Sie unregulierte Plattformen, die erhebliche finanzielle Risiken bergen können.
Technologierisiken sollten nicht übersehen werden, da der Handel stark von Handelsplattformen, Internetverbindung und Softwareausführung abhängt. Verzögerte Ausführung aufgrund langsamer Internetverbindung oder Serverproblemen kann zu unerwarteten Verlusten führen, Systemausfälle können dazu führen, dass Positionen länger offen bleiben als beabsichtigt, und es bestehen Cybersecurity-Risiken bei der Nutzung von Online-Handelsplattformen.
Es ist wichtig zu beachten, dass alle Handelsinformationen, Indikatoren, Signale oder Werkzeuge nur zu Bildungszwecken dienen und nicht als Finanzberatung betrachtet werden sollten. Händler sollten eigene Recherchen durchführen und gegebenenfalls einen lizenzierten Finanzberater konsultieren, bevor sie Investitionsentscheidungen treffen. Kein Indikator oder keine Strategie garantiert eine konstante Profitabilität, und die Verantwortung für alle Handelsentscheidungen liegt ausschließlich beim einzelnen Händler.
Die wichtigste Regel im Handel ist, niemals mit Geld zu handeln, dessen Verlust Sie sich nicht leisten können. Handel ist von Natur aus riskant, und Verluste können die ursprünglichen Investitionen übersteigen. Handeln Sie nur mit verfügbarem Einkommen, das Sie bereit sind zu verlieren, verwenden Sie niemals geliehenes Geld oder lebensnotwendige Ausgaben und diversifizieren Sie Ihre Investitionen, um nicht alle Mittel in einen einzigen Handel oder Vermögenswert zu stecken.
Handel ist eine risikoreiche Tätigkeit und sollte nicht als primäre Einkommensquelle betrachtet werden. Viele Händler verlieren Geld, und nur ein kleiner Prozentsatz erzielt langfristige Gewinne. Treffen Sie fundierte Entscheidungen, managen Sie Risiken und handeln Sie stets verantwortungsbewusst. Durch die Nutzung einer Handelsplattform, von Werkzeugen oder Indikatoren erkennen Sie die mit dem Handel verbundenen Risiken an und akzeptieren diese.
Handeln Sie verantwortungsbewusst. Bleiben Sie informiert. Schützen Sie Ihr Kapital. 🚀
Zusammenfassung
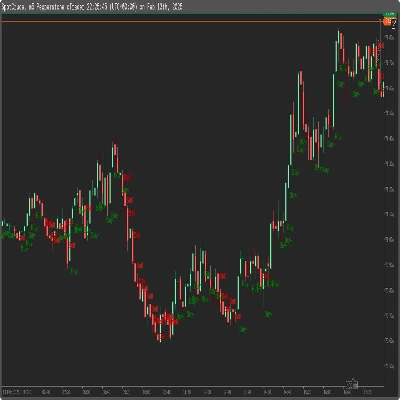
- Red Zone (Oversold): Closing price below the lower Bollinger Band and RSI below 30, signaling strong selling pressure and a potential buying opportunity.
- Green Zone (Overbought): Closing price above the upper Bollinger Band and RSI above 70, indicating strong buying pressure and a potential selling opportunity.
Visual markers include red-shaded zones for oversold conditions and green-shaded zones for overbought conditions. Alerts are provided via on-chart text notifications ("Deep Oversold Signal!" or "Deep Overbought Signal!") and sound signals when these conditions occur.
This tool assists traders by providing warning signals for potential market reversals at extreme price levels, helping to identify strong entry and exit points. It is suitable for various trading styles, including day trading, swing trading, and scalping, across different timeframes. The indicator supports markets such as forex, stocks, indices, and commodities.
Kundenbewertungen
5 | 100 % | |
4 | 0 % | |
3 | 0 % | |
2 | 0 % | |
1 | 0 % |