
説明
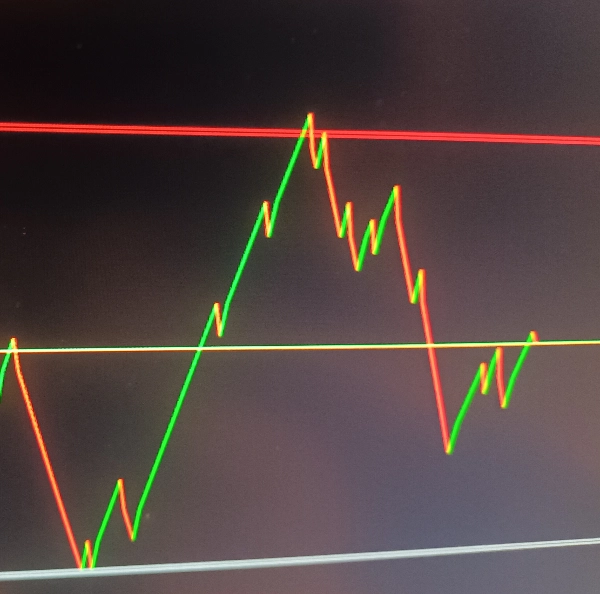
トレンドビジュアル:
価格の方向変化に基づいてトレンドライン(上昇トレンドは緑、下降トレンドは赤)を描画します
チャートに黄色の価格ラインをプロットします
サポート/レジスタンスゾーン:
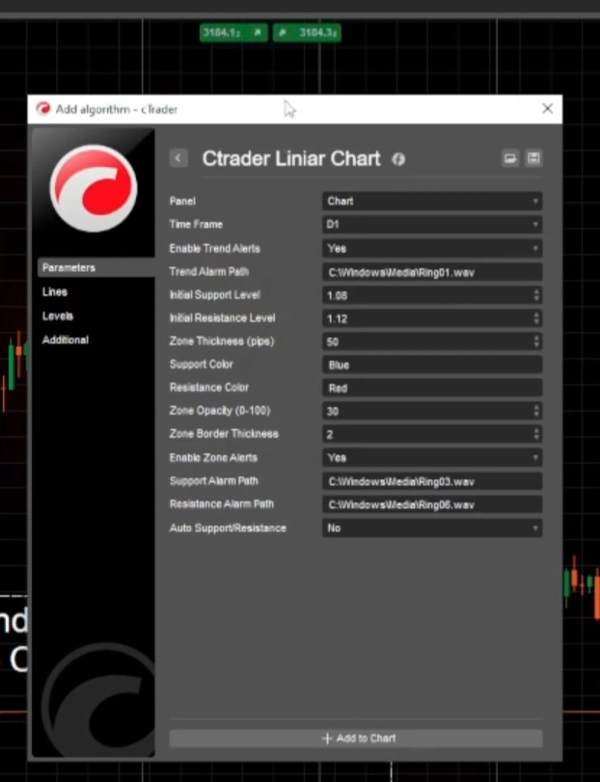
調整可能な厚さ(ピップ単位)の設定可能なサポートおよびレジスタンスレベル
ゾーンのカスタムカラーと不透明度
チャート上で手動で調整可能なインタラクティブなゾーン
アラートシステム:
トレンド変化のアラート(価格の方向が変わったとき)
サポート/レジスタンスゾーン到達のアラート
異なるイベント用のカスタムサウンドアラート
自動サポート/レジスタンス:
トレンドが変わったときにサポート/レジスタンスレベルを自動的に調整するオプション
仕組み
選択された時間枠を設定します(デフォルトは日足)
デフォルトまたはユーザー定義の値でサポート/レジスタンスレベルを設定します
ゾーン調整を定期的にチェックするためのタイマーを開始します
計算ロジック
各バーごとに現在の終値と前の終値を比較します
現在のトレンド方向(上昇/下降)を判定します
現在と前の価格の間にトレンドラインを描画します
トレンド方向が変わった場合:
オプションでサポート/レジスタンスレベルを自動的に更新します
トレンドアラートをトリガーします(有効な場合)
価格がサポート/レジスタンスゾーンに入ったかをチェックし、アラートをトリガーします
ゾーン管理
サポート/レジスタンスゾーンは半透明の長方形として描画されます
ゾーンはチャート上で手動で調整可能で、インジケーターはこれらの変更を追跡します
ゾーンの厚さはピップ単位で設定可能です
アラートタイプ
トレンドアラート:価格が方向を変えたとき(上昇/下降)にトリガーされます
ゾーンアラート:価格がサポート/レジスタンスゾーンに入ったときにトリガーされます
自動レベルアラート:自動サポート/レジスタンスが有効な場合、これらのレベルが自動調整されたときにアラートを発します
時間枠の選択
異なるアラートタイプの有効/無効切り替え
異なるアラート用のカスタムサウンドファイルパス
サポート/レジスタンスレベル。
概要
The indicator features configurable support and resistance zones displayed as semi-transparent rectangles, with adjustable thickness in pips, customizable colors, and opacity. These zones are interactive and can be manually adjusted on the chart, with the indicator tracking any changes.
An alert system notifies users of trend changes, price entries into support/resistance zones, and automatic adjustments of these levels if the auto-support/resistance feature is enabled. Alerts can be customized with different sound files and can be enabled or disabled individually.
The indicator periodically checks for zone adjustments and updates support/resistance levels automatically when trends change, if configured. It supports time frame selection and provides a comprehensive visual and alert-based approach to monitoring price trends and critical levels in trading charts.


