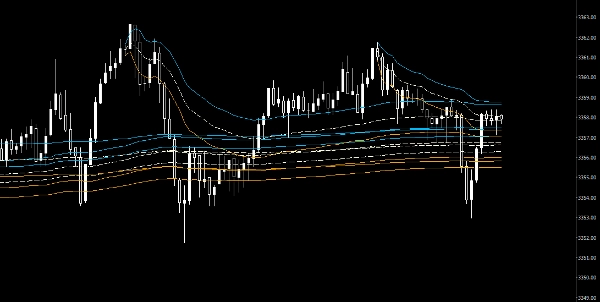
VWAP Tank Btn
「VWAP Tank Btn」ロゴ
04/08/2025
30
Desktop
登録日 03/08/2025
無料インストール
30

this custom vwap indicator let user select from which bar they wants to plot the vwap. this makes look chart more clearer and advance mode.

0.0
レビュー: 0
カスタマーレビュー
この商品にはまだレビューがありません。お使いになったことがある方は、ぜひレビューをお願いします。
これも好きかも
インジケーター
Indices
Prop
Commodities
+3
Period Separator
Period Separator that shows on all timeframes including renko and range bars.
Ichimoku Kinko Hyo
Ichimoku Kinkō Hyō with fixed shift to 25 as Ctrader calculate it from 0 and values was wrong for Chikou Span and Kumo.
Side Volume Profile
Right-anchored cTrader Volume Profile with VAH/VAL/POC, LVZ, top volume+EMA, themes, and fast, readable visuals.
インジケーター
Grid
NAS100
NZDUSD
+18
Supertrend Indicator v1.1
SUPERTREND INDICATOR v1.1
Fisher_m11
Fisher Transform with smoothing. Spot reversals and cycles with precision. Great for any market, any timeframe.
インジケーター
RSI
Breakout
Supertrend
Swing Levels
🔍 Automatically detect support and resistance levels based on "swings" or pivots
E7 Polynomial Regression Channel
Polynomial Regression Channel which also reflects the volatility of the underlying asset.
インジケーター
Grid
XAUUSD
Forex
+3
Daily Open Color Zones
indicator showing the Daily Open Line and instantly shading bullish and bearish zones.
インジケーター
Indices
FVG
Commodities
+4
FAIR VALUE GAP INDICATOR
Pinpoint FVGs, track fills and see mitigation stats — trade imbalances with clarity and confidence.
インジケーター
NAS100
Indices
Breakout
+7
ORB Range with FVGs
This indicator plots the 15m opening range of the NY session with the first N FVGs presented on the chart after the open
インジケーター
NAS100
RSI
NZDUSD
+15
RSI + EMA Crossover Signals
Dual confirmation RSI + EMA crossover signals with visual alerts and dynamic ATR offsets.
インジケーター
Grid
Indices
Breakout
+8
TSPivotSMC
Pivot Point MultiTimeFrame with Order Block
FAMA-MAMA
The FAMA-MAMA Indicator is a powerful, adaptive trend-following tool designed for professional and algorithmic traders.
インジケーター
Signal
MACD
USDJPY
PulseTracker
Version 1.2: Advanced Trend Detection & Visualization System
KDJ
The KDJ oscillator display consists of 3 lines (K, D and J - hence the name of the display) and 2 levels.
EMA UP&DOWN 2025
SectorIndex Dual Moving Average Indicator: Your Market Compass 🧭