
説明
説明ビデオ: https://youtu.be/2LrUPENoLCk
以下と一緒にのみ使用してください Future-AI cBot! (https://ctrader.com/products/1359?u=Pilipenko)
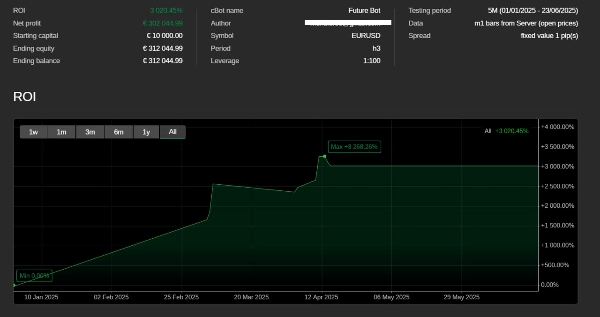
推奨シンボル - EURUSD
推奨タイムフレーム - H3, H2
概要
インジケーターのプロフィール
カスタマーレビュー
0.0
レビュー: 0
カスタマーレビュー
この商品にはまだレビューがありません。お使いになったことがある方は、ぜひレビューをお願いします。
ディスカッション
よくあるご質問
EURUSD
AI
cTrader Storeで入手可能な取引ボット、インジケーター、プラグインなどの商品は、第三者の開発者が提供するものであり、情報と技術の取得のみを目的としてご利用いただけます。cTrader Storeはブローカーではなく、投資助言や個人的な推奨を行うことも、将来のパフォーマンスを保証することもありません。


価格
登録日 12/06/2025
34
無料インストール