
Description
Ultimate RSI (Indice de Force Relative)
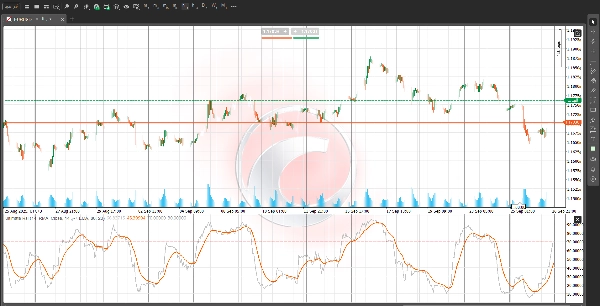
Le Ultimate RSI est un oscillateur avancé et personnalisé conçu pour fournir une lecture plus fluide, plus claire et plus réactive du momentum du marché et de la force de la tendance. Il représente une amélioration significative par rapport à l'Indice de Force Relative (RSI) traditionnel, en se concentrant sur le filtrage du bruit du marché et la minimisation des faux signaux (whipsaws). Cela en fait un outil inestimable pour confirmer les tendances et identifier des points de retournement fiables.
Caractéristiques clés et améliorations :
- Calcul du momentum augmenté : L'indicateur utilise une méthode sophistiquée pour calculer le changement de prix. Au lieu de se fier uniquement aux mouvements de prix quotidiens, le signal de momentum est considérablement renforcé lorsque le prix enregistre un nouveau plus haut ou un nouveau plus bas dans la période de référence. Ce processus garantit que l'indicateur réagit puissamment aux cassures réelles tout en ignorant les mouvements mineurs et erratiques.
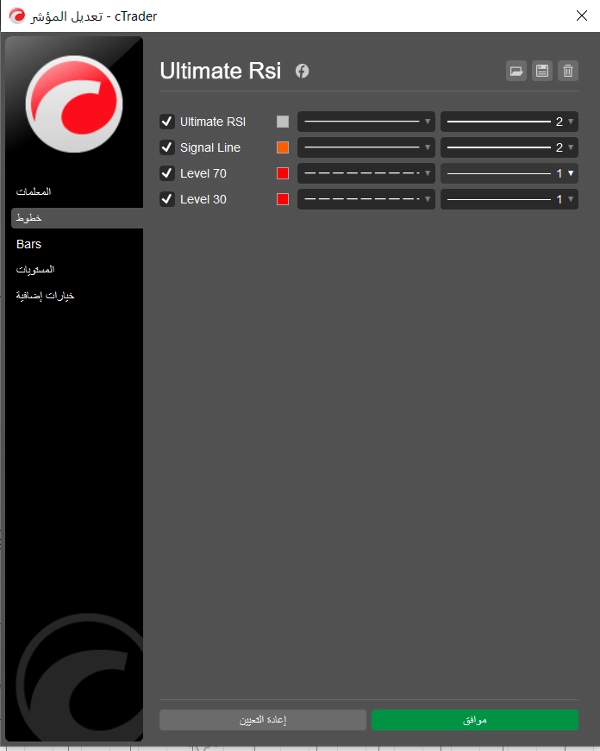
- Ligne de signal dédiée : Il comprend une ligne de signal distincte (une moyenne mobile du RSI lui-même) qui peut être configurée indépendamment. Les croisements entre la ligne Ultimate RSI et sa ligne de signal sont souvent utilisés comme déclencheurs plus clairs et plus fiables pour les entrées ou sorties, en particulier près des niveaux de surachat/survente.
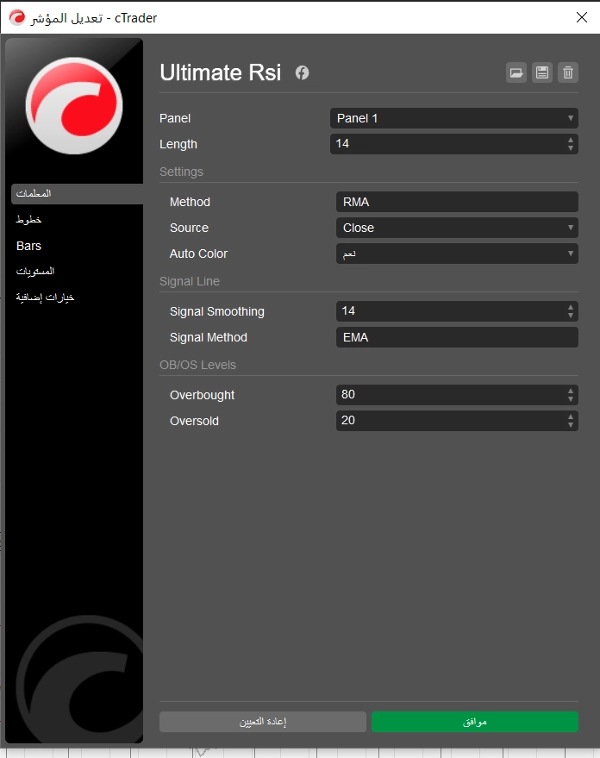
- Méthodes de lissage flexibles : Les utilisateurs ont la flexibilité de choisir le type de lissage pour le calcul du RSI et la ligne de signal parmi les options courantes : EMA (Moyenne Mobile Exponentielle), SMA (Moyenne Mobile Simple), RMA (Moyenne Mobile de Wilder), et TMA (Moyenne Mobile Triangulaire). Cela permet une personnalisation précise de la sensibilité de l'indicateur.
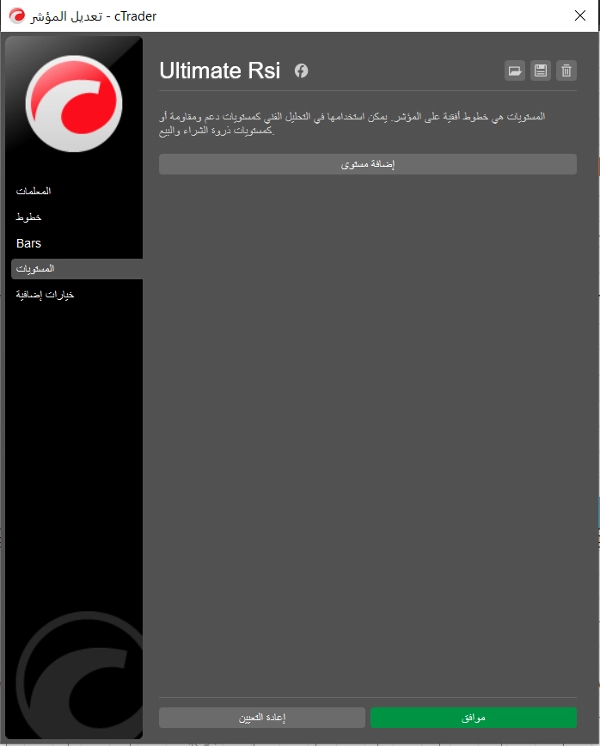
- Zones visuelles OB/OS : Le niveau par défaut de surachat (OB) à 80 et le niveau de survente (OS) à 20 sont clairement marqués par un ombrage de fond. Dans les marchés fortement tendance, des lectures soutenues dans ces zones indiquent souvent une force de tendance exceptionnelle plutôt qu'un renversement immédiat, offrant un outil de confirmation puissant pour les stratégies de suivi de tendance.
Comment trader avec l'Ultimate RSI :
- Confirmation de tendance : Utilisez le niveau 50 comme centre de momentum. Une lecture constamment au-dessus de 50 confirme une tendance haussière, tandis qu'une lecture en dessous de 50 confirme une tendance baissière.
- Signaux d'entrée : Recherchez la ligne Ultimate RSI qui croise au-dessus de la ligne de signal pour une entrée longue potentielle, et qui croise en dessous de la ligne de signal pour une entrée courte potentielle, en prêtant une attention particulière à l'endroit où ces croisements se produisent par rapport au niveau 50.
- Réduction du bruit : En mettant l'accent sur l'expansion réelle de la plage et en utilisant un lissage avancé, l'Ultimate RSI aide les traders à rester concentrés pendant les périodes de consolidation, évitant ainsi les entrées ou sorties prématurées.
Avertissement : Cette description est fournie à des fins d'information et d'éducation uniquement. Le trading comporte des risques, et toutes les lectures d'indicateurs doivent être combinées avec une analyse complète de l'action des prix pour toute décision de trading.


